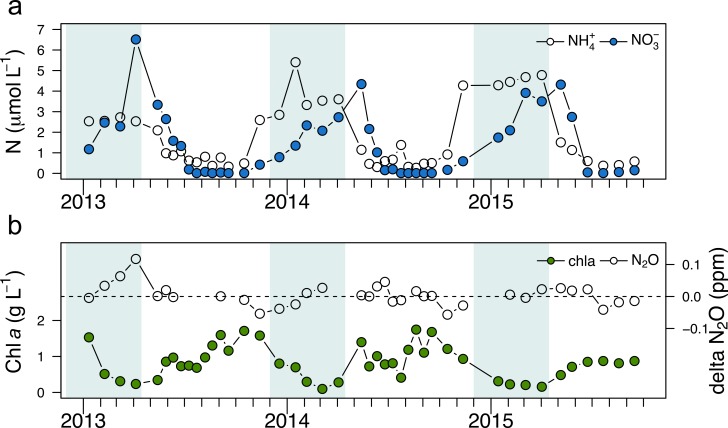
Fig 5.
Temporal variation in surface water a) ammonium (NH4+) and nitrate (NO3- + NO2-) and b) chlorophyll a and delta N2O between January 2013 and September 2015 from sample collected as part of lake sentinel project in lake Croche. Dotted line in panel b) represents N2O concentrations at equilibrium with air. The period where the lake was covered by ice is depicted by a light blue rectangle. Tick mark spacing represent month starting in January.

