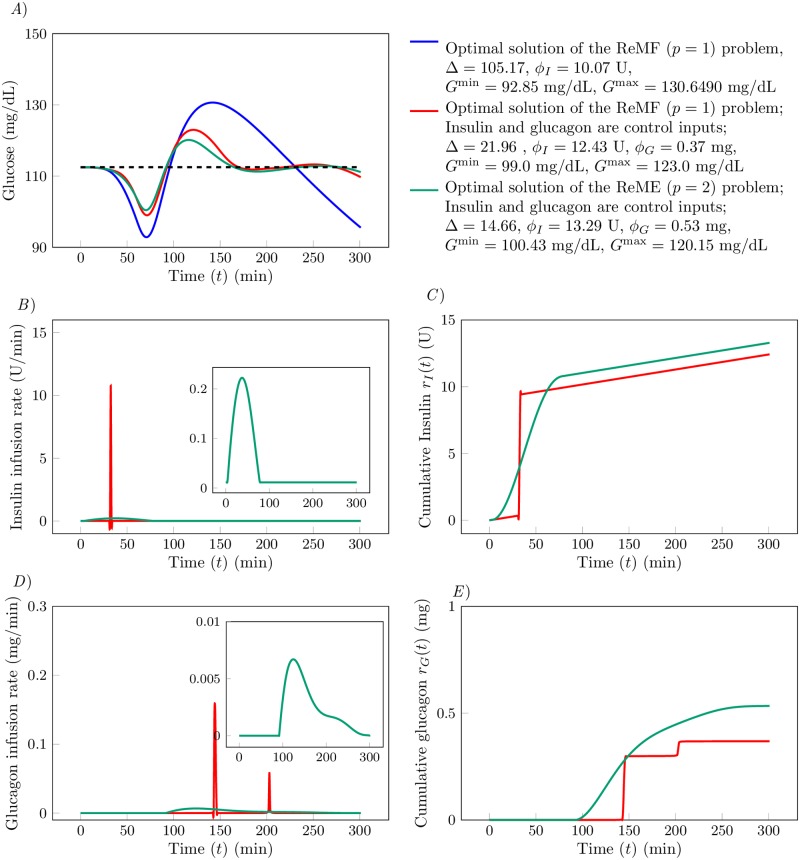
Fig 5.
A) Time evolution of glucose G(t) (in mg/dL). The blue curve corresponds to uI(t) obtained by solving the ReMF problem. The red curve corresponds to uI(t) and uG(t) obtained by solving the ReMF problem using the dual drug therapy. The green curve corresponds to uI(t) and uG(t) obtained by solving the ReME problem using the two-drug-therapy. B) Time evolution of the insulin infusion rate uI(t) (in mg/dL). Color code is consistent with A. C) The cumulative insulin supply rI(t) as a function of time t. D) Time evolution of the glucagon infusion rate uG(t) (in mg/dL). E) The cumulative glucose supply rG(t) as a function of time t.

