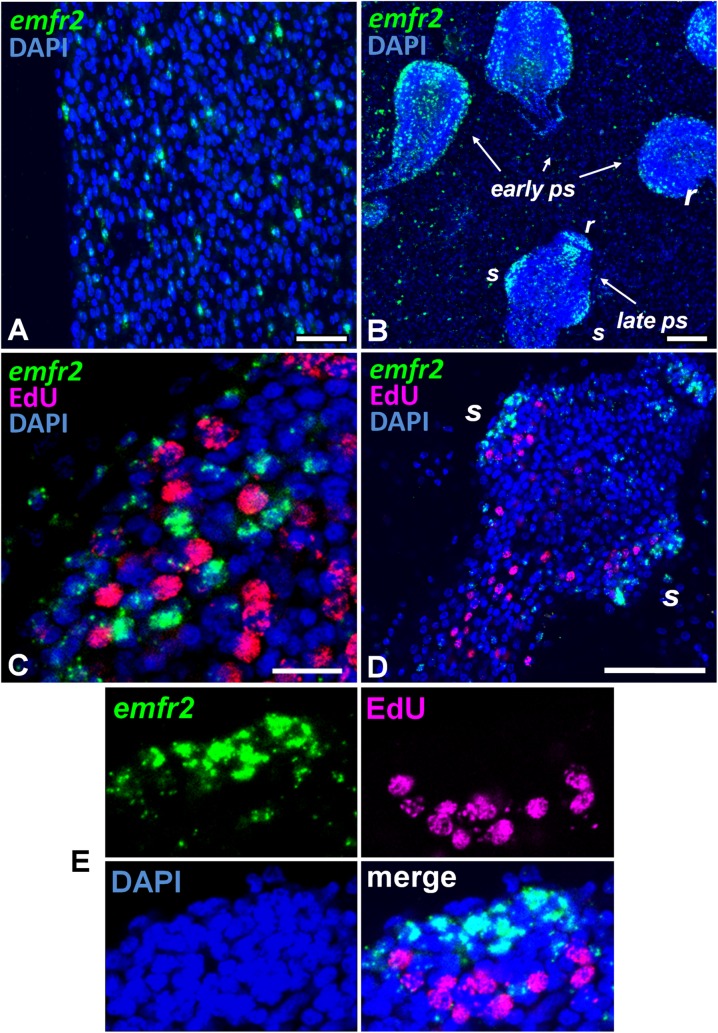
Fig 3. WMISH analysis of emfr2 expression.
Shown are WMISH analyses of emfr2 expression (A, B) and co-detection of emfr2 WMISH and EdU incorporation (C, D, E) during metacestode development. In C, D, and E, metacestodes were cultured in vitro with 50 μM EdU for 5 h and were then processed for WMISH and EdU detection. In all panels the WMISH signal is shown in green, EdU detection in red, and DAPI nuclear staining in blue. A, detail of the germinal layer. B, general view of a region of a metacestode with protoscoleces in different stages of development. C, early protoscolex development. D, late protoscolex development. E, Detail of a sucker, maximum intensity projection of a confocal Z-stack. r, rostellum; s, sucker. Bars are 20 μm for A, 50 μm for B, 10 μm for C, and 50 μm for D. Sense probe (negative control) was negative in all samples.

