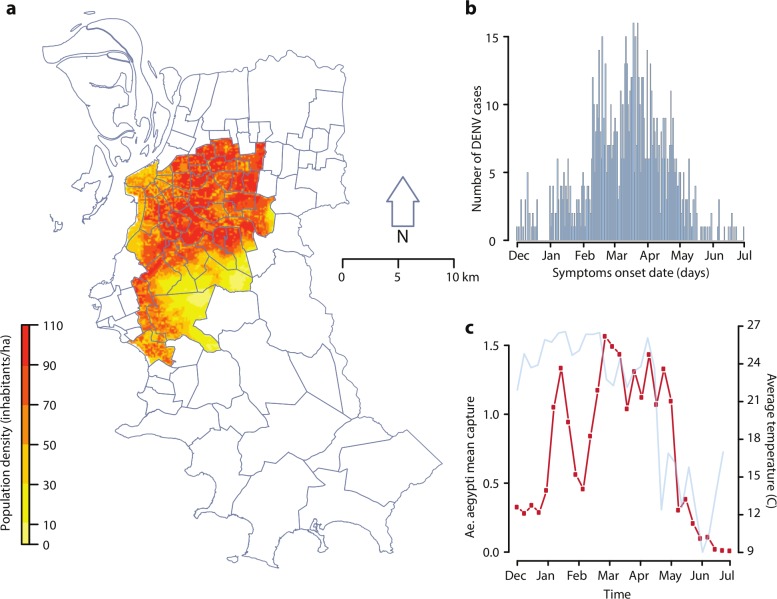
Fig 1. Study area, DENV recorded cases, mosquito collections and temperature data.
a) Map of the selected study area within the city of Porto Alegre and corresponding population density; b) dengue cases in the selected study area over time; c) average captures of Ae. aegypti female adults per trap over time (red, left axis), with corresponding weekly temperature values (light blue, right axis). Map was generated using shapefiles publicly available from Porto Alegre municipality.

