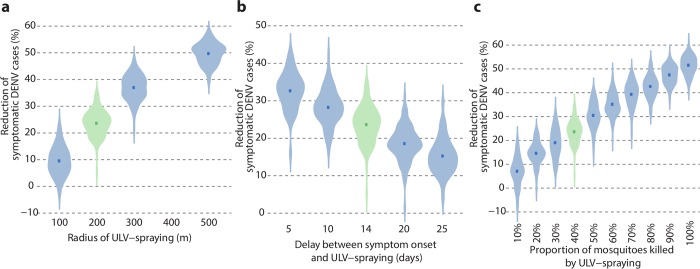
Fig 5. Sensitivity analysis on effectiveness of control interventions.
Violin plots for the distributions of the average percentage of avoided DENV symptomatic cases by (a) radius of the treated area, (b) average delay between symptom onset and intervention and (c) proportion of mosquitoes killed by ULV spraying. The distributions are computed from 100 averages over 1,000 clusters randomly sampled from the 20,000 simulated clusters. Squares represent the average values.

