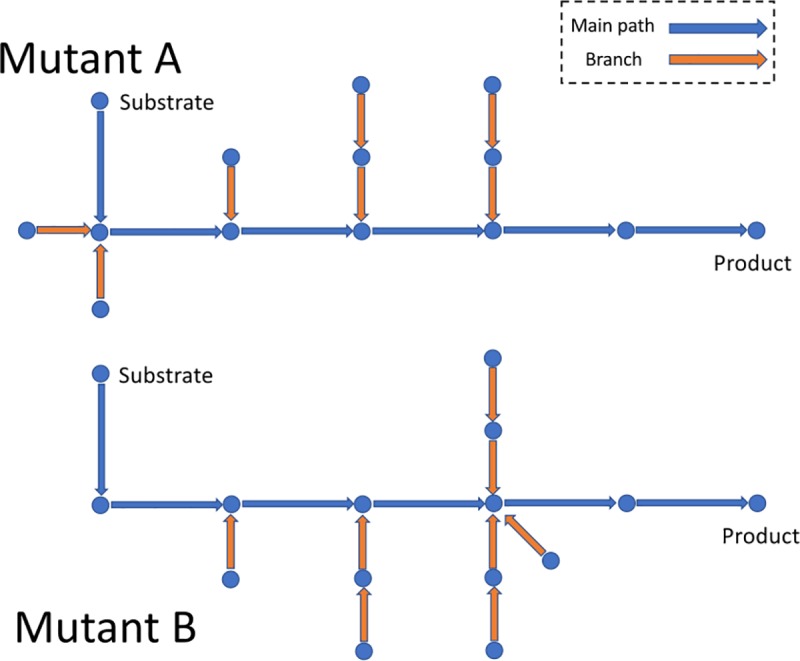
Fig 2. A diagram of implementation cost calculation according to connection of branch paths to the main path.

This figure shows the main path and branches of two hypothetical mutant strains. Blue circles indicate metabolites, arrows in blue and orange indicate reactions on the main path and branch paths respectively.
