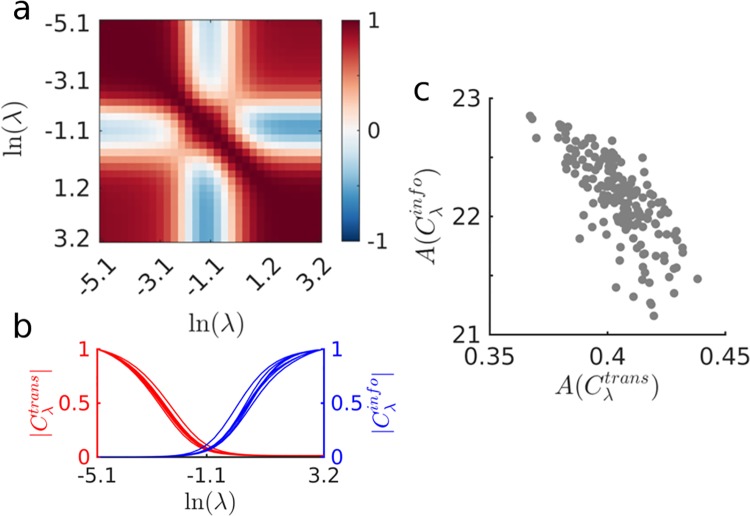
Fig 6. Communication cost trade-off within subjects.
(a) Correlations between all subject’s across all values of λ. Positive correlations are colored in red, negative correlations are colored in blue. (b) Eight subject’s and curves after normalization with respect to the and , respectively. Notice how some subject’s curves decay faster than others, and how some subject’s curves grow faster than others. (c) Scatter plot of the computed areas under the normalized and curves, sowing a trade-off between the decay of and the growth of (the correlation between and is r = -0.74, p < 0.001).

