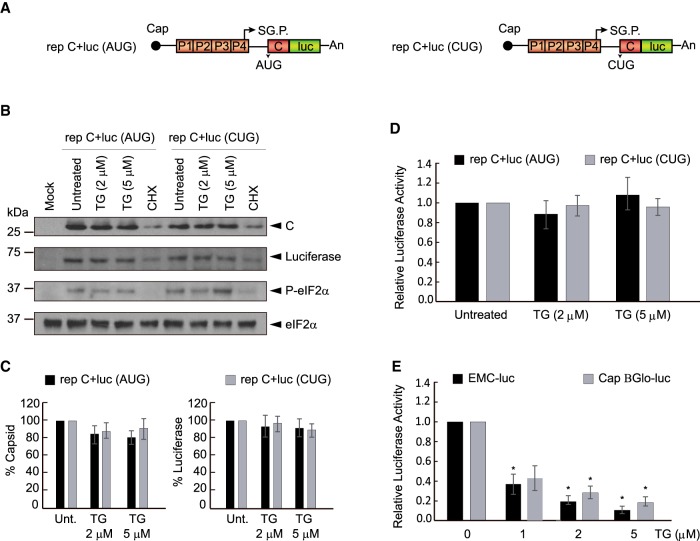
FIGURE 1.
Analysis of C protein synthesis by SINV replicons bearing AUG or CUG as the initiation codon. (A) Schematic representation of rep C + luc (AUG) and rep C + luc (CUG). (B) BHK cells were transfected with in vitro transcribed replicons. After 3 h, cells were treated or not with thapsigargin (TG; 2 or 5 µM) or cyclohexamide (CHX; 50 µg/mL) for 2 h. Cells were collected in loading buffer and analyzed by western blotting using anti-C, anti-luciferase and anti-P-eIF2α antibodies. Additionally, eIF2α was analyzed as a loading control. (C) Densitometric analysis of C and luciferase are shown in the graphs as the relative percentage of their corresponding untreated controls. The values from CHX treatments were subtracted from all as a baseline. Error bars represent the standard error of the mean, n = 3. (D) Luciferase activity is represented as the percentage relative to the untreated controls. The readings from CHX treatments were subtracted from all as a baseline. Error bars represent the standard error of the mean, n = 3. (E) BHK cells were transfected with in vitro transcribed RNAs EMCV-luc or Cap.BGlo-luc. One hpt, cells were treated or not with TG (1, 2, or 5 µM) or CHX (50 µg/mL) for 2 h. Then, luciferase activity was measured and is represented in the graph as percentage relative to the untreated control. The readings from CHX treatments were subtracted from all as a baseline. Error bars represent the standard error of the mean, n = 3. Statistical significance in panels C–E was calculated compared to control using Student's t-test unpaired two-tails t-test, and is shown as: (*) P < 0.05

