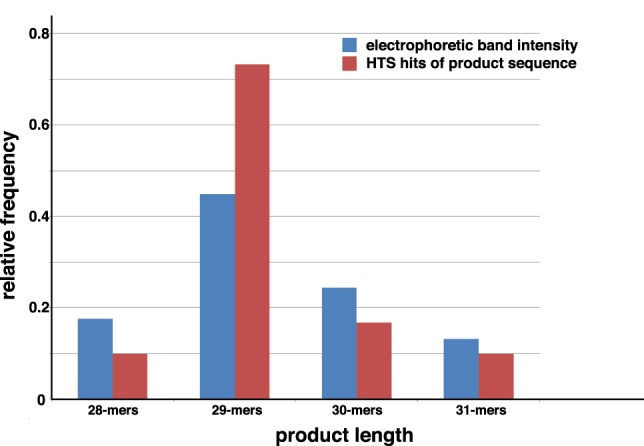
FIGURE 4.

Comparison of relative electrophoretic band intensity and HTS frequency for R16 self-incubation products. (Blue bars) Relative band intensities for 28-, 29-, and 30-mers (α′ products), along with 31-mers (β products) from the image in Figure 3B at 7 d. (Red bars) Relative number of HTS hits from Table 1. Values scaled to sum equals 1.0.
