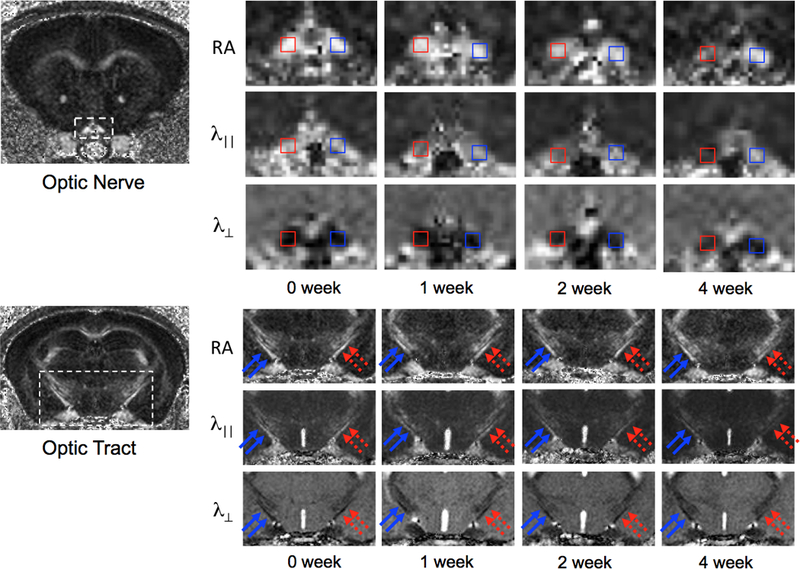
Figure 1.

DTI maps of ON and OT in mice after retinal ischemia. Because the majority of RGC axons project to the opposite hemisphere of the brain, damage in the right ON (red, top panel) is associated with damage in the left OT (dashed red arrows, lower panel), showing gradual decreases in RA and λ||, and gradual increases in λ⊥ over time.
