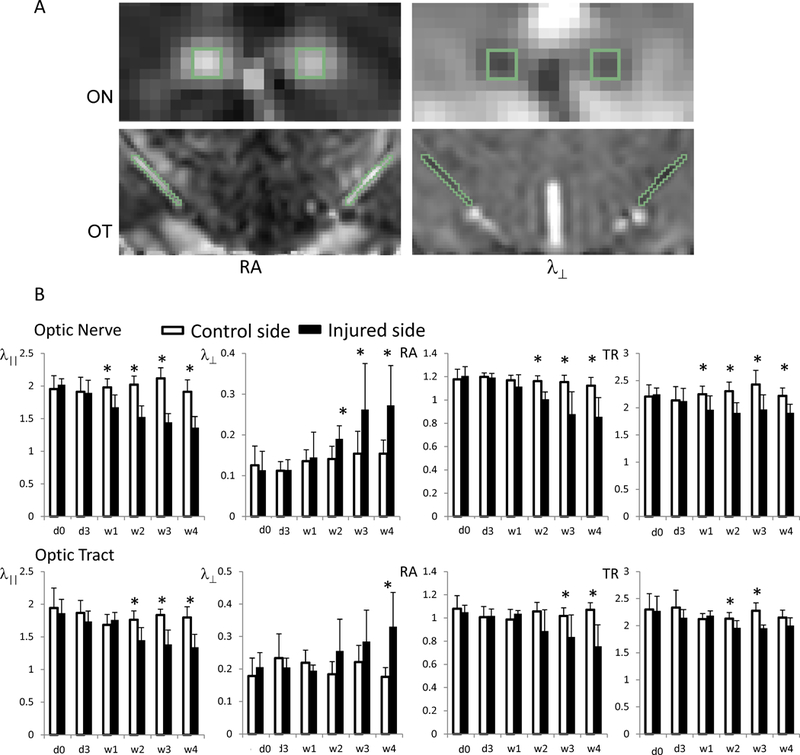
Figure 2.

DTI indices of ON and OT in mice after retinal ischemia. The top panel (A) shows an example of ROI selections from the ON and OT on RA and λ⊥ maps. ON and OT appear bright on RA and dark on λ⊥ maps. ROIs were selected in the central portion of ON and OT using synchronized tracing on RA and λ⊥. The bottom panel (B) shows a summary of the measurements. The injured ON and OT (black bars) showed gradual decreases in RA and λ||, and gradual increases in λ⊥ relative to controls. The changes in ON occur 1 – 2 weeks before changes manifest in the OT. The value unit for λ||, λ⊥, and TR is µm2/s. RA is unitless. The “*” indicates significant differences with p < 0.05, compared to the controls.
