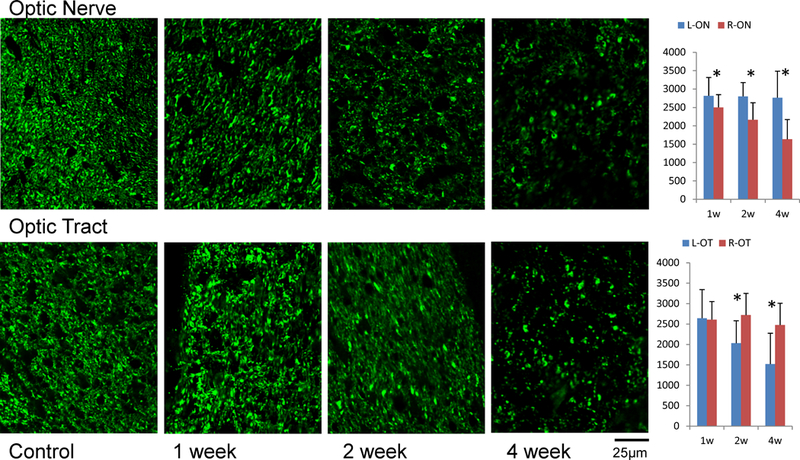
Figure 3.

SMI-31 immunohistochemistry in the ON and OT after retinal ischemia. The density of SMI-31 positive axons (axon counts in 100×100 µm2) is summarized in the bar graphs (right, N = 7). The “*” indicates significant changes with p < 0.05. The right ON and left OT showed degeneration as gradual loss of SMI-31 examined at 1, 2, and 4 weeks after retinal ischemia. The loss of axons was significant in the ON beginning at week 1, but gained significance in the OT after two weeks.
