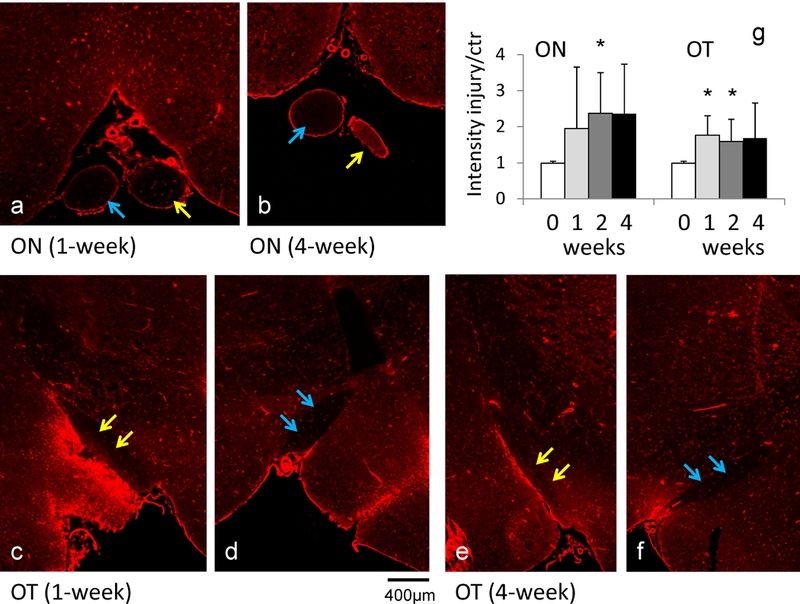
Figure 6.

Evans blue staining (a - f) of the ON and OT after retinal ischemia. Evans blue dye detects the presence of albumin. The injured ON (yellow arrows in a and b) and injured OT (yellow arrows in c and e) showed stronger signal than the contralateral ON (blue arrows in a and b) and OT (blue arrows in d and f), respectively. The signal intensity analysis (g) showed increased signal in the injured ON and OT beginning one week after retinal ischemia. The “*” indicates p < 0.05 compared to controls.
