Fig. 2.
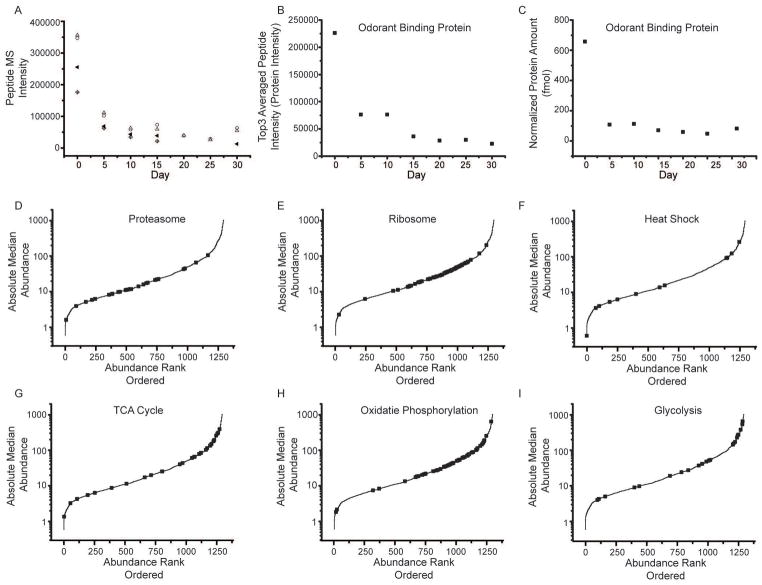
Label-free protein quantification. (A) An example of peptides from odorant binding protein (Q7K084). For each peptide, the precursor intensity as a function of day was plotted. The four peptides identified were SPANEWAFR (open circle), TFDYPDDDITR (triangle), GFKVENLVAQLGQGKEDK (cross diamond), and VENLVAQLGQGKEDK (center dot diamonds). Peptides show good correlation with each other across the time points. (B) The top 3 peptide intensities were then averaged together to determine the protein intensity at each day. (C) Using an internal standard, equine alcohol dehydrogenase, an absolute abundance can also be determined. (D–I) Lifespan median absolute abundance data were plotted for all proteins in rank abundance order along the X axis. Black squares represent specific groups of proteins associated with biochemical pathways; including proteasome (D), ribosome (E), heat shock (F), TCA cycle (G), oxidative phosphorylation (H), and glycolysis (I).

