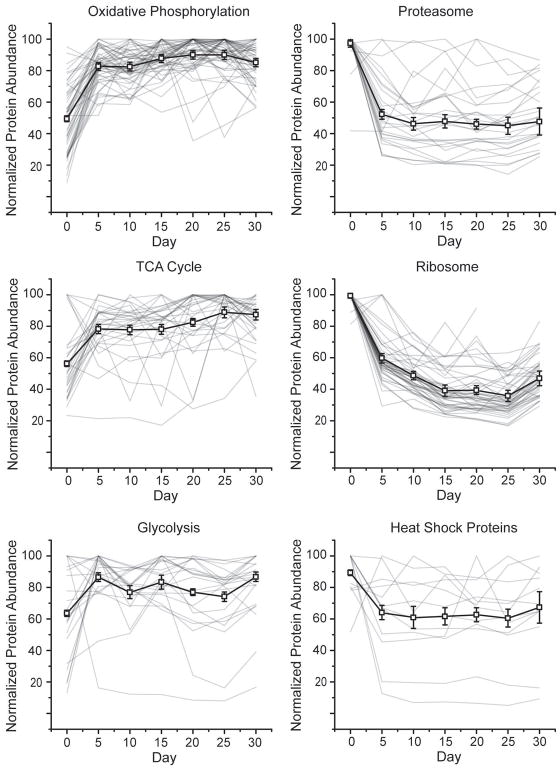
Fig. 4.
Normalized temporal abundances for proteins of various biological function. Proteins annotated as oxidative phosphorylation (A), proteasome (B), TCA cycle (C), ribosome (D), glycolysis (E), and heat shock proteins (F) using the bioinformatics gene annotation program David are shown (HSPs annotations were extracted from Uniprot). For all classes, the median protein abundance is plotted as the thick black line with error bars denoting SEM. Within each line plot, all individual proteins are shown as thin grey lines.

