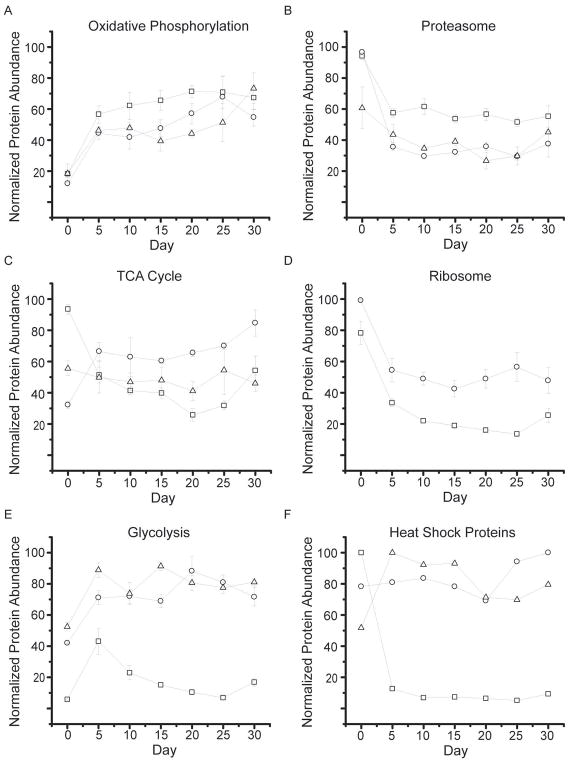
Fig. 5.
Average protein abundance measurements. Cytochrome b c1 subunit 7 and 9 are shown as squares and circles, respectively along with protein stunted isoform B in triangles. (A) Proteasome core subunits alpha 7 and beta 1 are shown as open circles and open triangles, respectively. (B) An accessory proteasome protein Ter94 is shown as squares. (B) Aconitase hydratase, pyruvate carboxylase and ATP citrate synthase are given as squares, circles, and triangles, respectively. (C) Ribosome protein subunit 17 and 24 are shown as circles and squares, respectively. (D) Aldose 1 epimerase, phosphotransferase, and triosephosphate isomerase are squares, circles and triangle, respectively. (E) Heat shock protein 27, 60 kDa heat shock protein mitochondrial homolog, and the HSP 70 kDa protein are shown as squares, circles, and triangles, respectively. (F) Error bars represent SEM.

