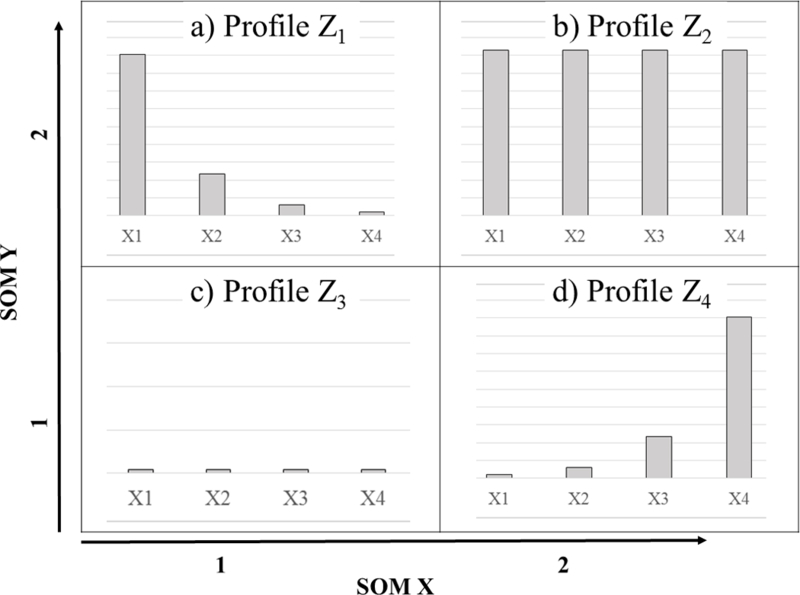
Figure 2.

A hypothetical ‘map’ of profiles (Z) produced by a self-organizing map (SOM) set to target four groups, k = 4. Each example profile is illustrated using a bar to reflect the sample mean () for component () during events assigned to profile . SOM coordinates are presented as XY-axes.
