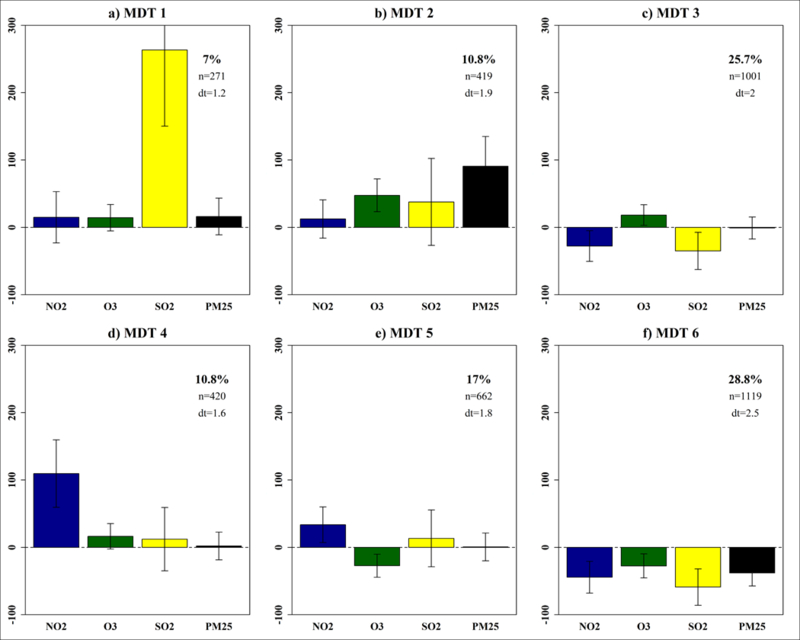
Figure 4.

A 3×2 SOM of six multipollutant day types (MDTs) identified in Columbia, SC from January 1, 2002 to December 31, 2013. For each panel, the MDT profile is illustrated using a barplot that reflects the pollutant sample means (error bars reflect one standard deviation) for the group of days assigned to the MDT. Bars have zeroed to the overall (population) mean on presented on a percentage scale. Labels are in at the top of each profile and the relative frequencies (%), within-class sample size (n), and durational time (dt) are presented in the upper right hand corner of each panel.
