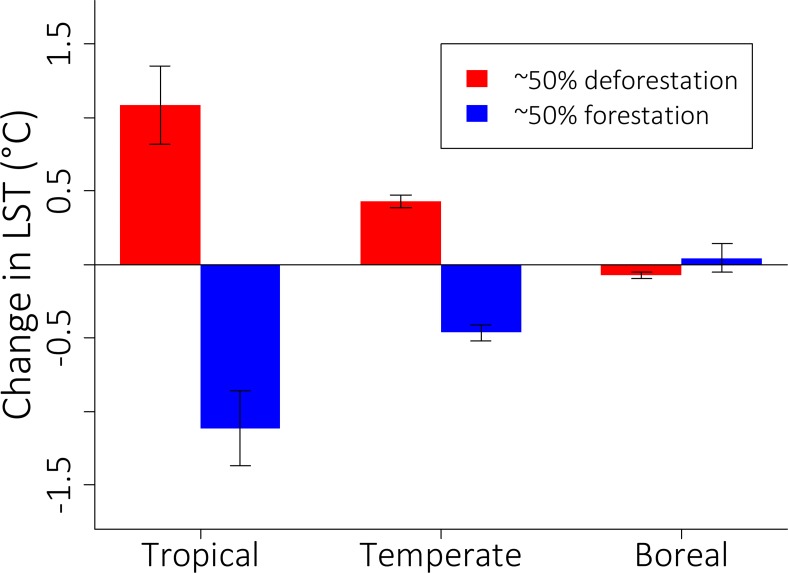
Fig 4. Comparative effects of deforestation (red) and forestation (blue) on annual land surface temperature (LST) change.
This analysis considered only cells with ~50% (40–60%) of decadal forest change (2010–2000). Positive (negative) values indicate a warming (cooling) effect of forest change. Bars indicate averages and 95% confidence intervals. The number of cell pairs analyzed (left to right) was 40, 15, 694, 268, 861 and 25.

