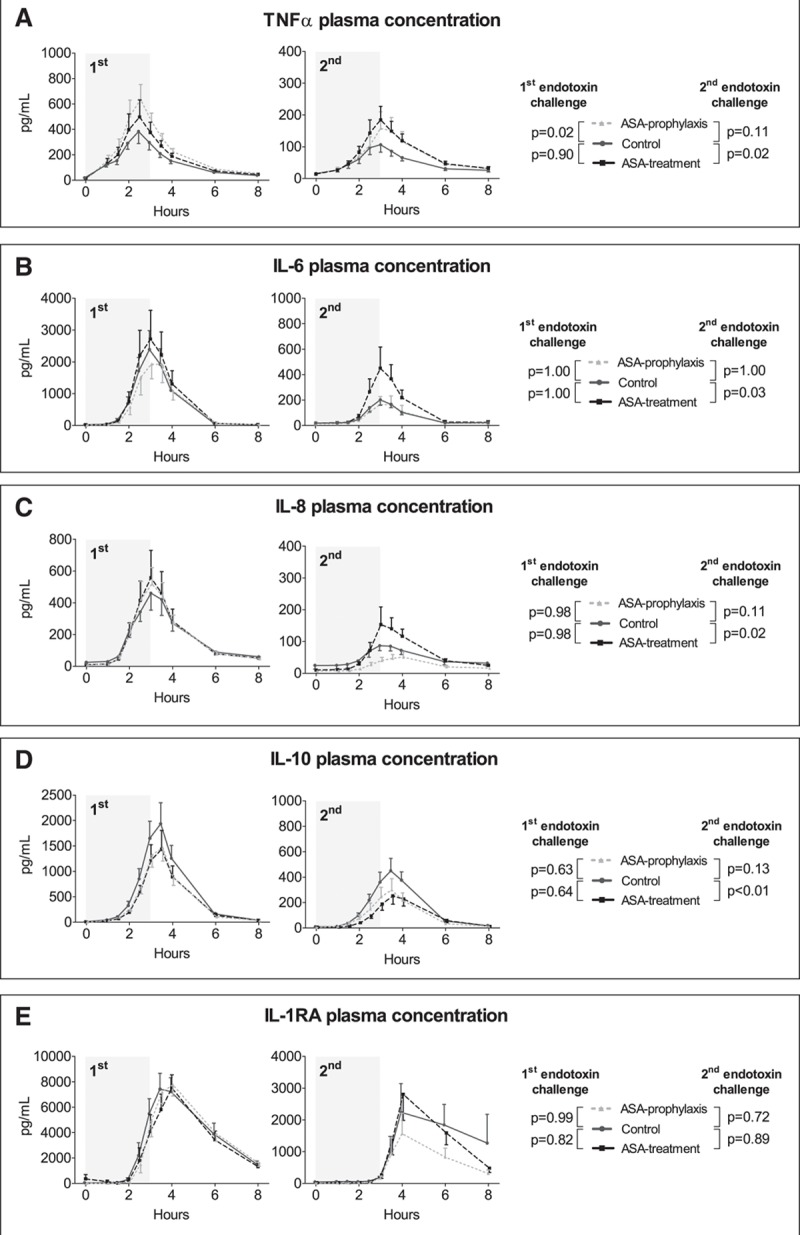
Figure 2.

Plasma levels of tumor necrosis factor (TNF)-α (A), interleukin (IL)-6 (B), IL-8 (C), IL-10 (D), and IL-1 receptor antagonist (RA) (E), upon the first and second endotoxin challenge. Cytokine concentrations over time are depicted as mean and sem. The gray area indicates the 3-hr endotoxin administration period. p values represent the interaction term of repeated measures two-way analysis of variance. ASA = acetylsalicylic acid.
