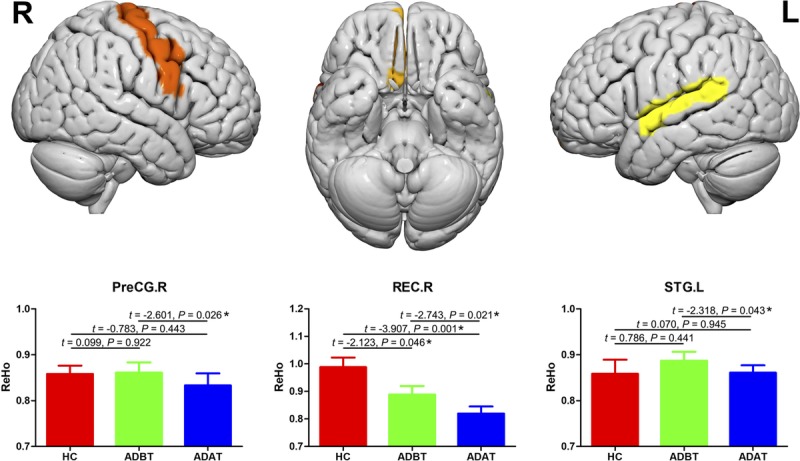
FIGURE 3.

Changes in local spontaneous brain activities between the pretreatment and the posttreatment measurements and between the patients and the controls. Error bars represent SEs. ADAT, patients with AD after treatment; ADBT, patients with AD before treatment; HC, healthy controls; L, left; R, right.
