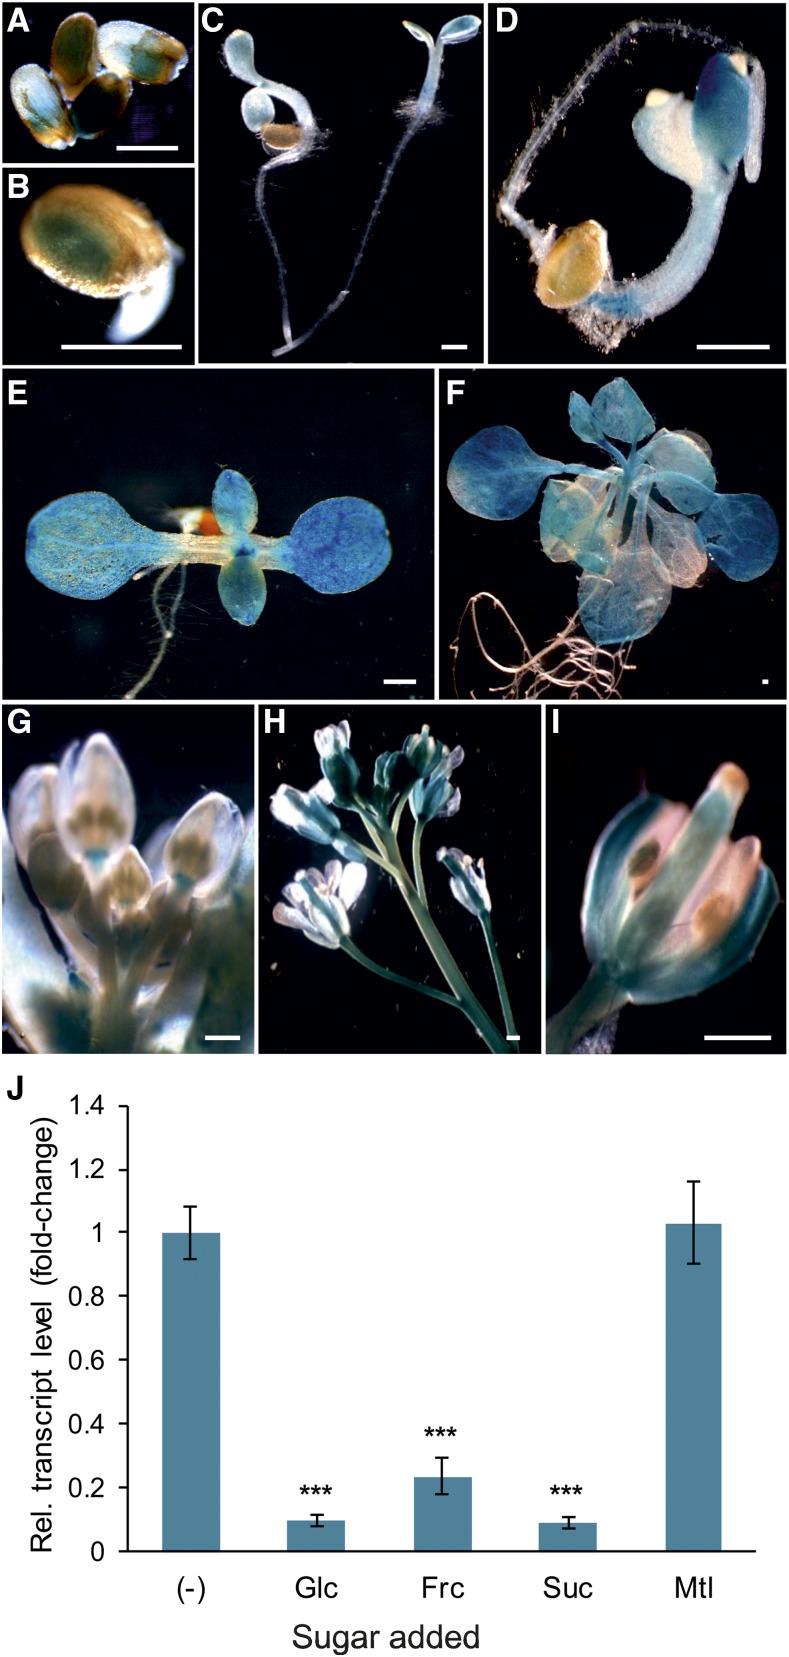
Figure 4.
Analysis of the tissue-specific and sugar-dependent expression of pSuT. A to I, Transgenic plant lines expressing the glucoronidase reporter gene uidA under the control of the pSuT promoter were subjected to histochemical staining for GUS activity. A and B, GUS staining of germinating seeds. C and D, GUS staining in young seedlings. E, GUS staining in the cotyledons and the vegetative leaves of a 7-d-old seedling. F, GUS staining in rosette leaves of a 3-week-old plant. G, GUS staining of flower buds. H, GUS staining of an inflorescence. I, GUS staining of an opened flower. Bars = 0.5 mm. J, Expression of pSuT is repressed by exogenously supplied sugars. Leaf discs of 6-week-old wild-type plants were incubated in 300 mm Glc, Fru (Frc), Suc, mannitol (Mtl), or solely MES buffer as a reference (−). The data were normalized to the housekeeping genes At4g26410, At1g13320, and At4g05320. Fold change in expression was calculated relative to pSuT expression in MES buffer (set to 1). Data represent means of six biological replicates ± se. Significant differences by one-tailed Student’s t test (***, P ≤ 0.001) are shown in relation to that in the reference sample (−).

