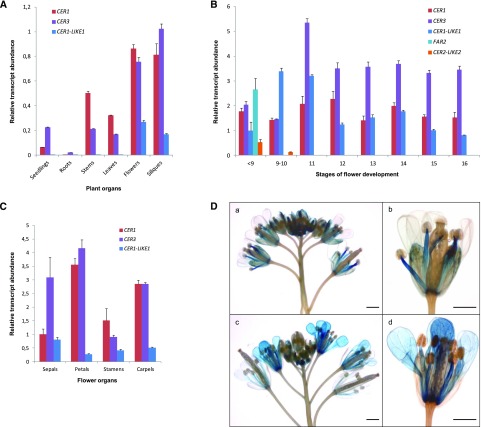
Figure 3.
Expression analysis of CER1-LIKE gene family in Arabidopsis. A, Differential expression analysis of Arabidopsis CER1, CER3, and CER1-LIKE1 transcripts in various organs of Arabidopsis. The gene expression level was determined by RT-qPCR analysis. Results are presented as relative transcript abundance. The relative transcript abundance of ACT2, EF-1a, eIF-4A-1, UBQ10, and PP2A in each sample was determined and used to normalize for differences of total RNA amount. The data represent the means ± sd of five replicates. Total RNA was isolated from 15-d-old seedlings, roots, stems, leaves, flowers, and siliques. B, Differential expression analysis of CER1, CER3, CER1-LIKE1, FAR2, and CER2-LIKE2 genes in Arabidopsis flowers throughout development, following the staging described by Smyth et al. (1990) for early floral development. The relative transcript abundance of ACT2 and eIF-4A-1 in each sample was determined and used to normalize for differences of total RNA amount. Results for each gene are presented as transcript abundance compared to expression level of CER1-LIKE1 at stage <9. The data represent the means ± sd of three replicates. C, Differential expression analysis of CER1, CER3, and CER1-LIKE1 genes in Arabidopsis flower organs at stage 14. The relative transcript abundance of ACT2 and eIF-4A-1 in each sample was determined and used to normalize for differences of total RNA amount. Results for each gene are presented as transcript abundance compared to expression level of CER1 in sepals. The data represent the means ± sd of three replicates. D, Spatial expression patterns of the CER1-LIKE1 (a and b) and CER1 (c and d) genes in transgenic Arabidopsis plants harboring the CER1-LIKE1 and CER1 promoters fused to the GUS reporter gene. Promoter activity was visualized through histochemical GUS staining on flower buds (a and c, scale bars = 1 mm) and flower at stage 15 (b and d, scale bars = 2 mm).

