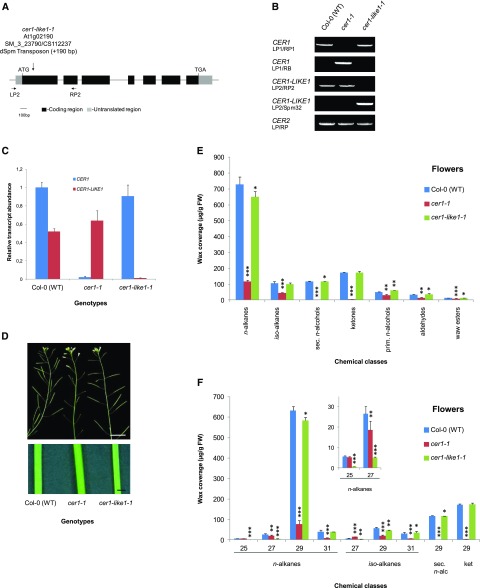
Figure 4.
Characterization of cer1-like1 and cer1 mutants, including flower wax composition. A, Schematic of CER1-LIKE1 gene structure indicating the position of the transposon in the mutant cer1-like1-1 allele. Dark boxes indicate exons, black lines indicate introns, and gray boxes indicate 5′- and 3′-untranslated regions. The arrows underneath the gene structure are the positions of convergent primers (LP2 and RP2) used for PCR on genomic DNA. B, PCR on genomic DNA of wild-type (Col-0) plants, cer1, and cer1-like1-1 mutants. Amplification of the CER2 gene was used as a positive control. C, RT-qPCR analysis of CER1-LIKE1 and CER1 gene expression in flowers of the different lines compared to that in wild-type plants as indicated above. The relative transcript abundance of ACT2 and eIF-4A-1 was determined in each sample and used to normalize for differences of total RNA amount. Results for each gene are presented as transcript abundance compared to the expression level of CER1 in wild-type (Col-0) plants. The data represent the means ± sd of three replicates. D, Stems from 6-week-old plants of the cer1-1 mutant showing glossy and sterility phenotypes compared with that of the wild-type (Col-0) and the cer1-like1-1 mutant (top, scale bar = 1 cm; bottom, scale bar = 1 mm). E, Cuticular wax compound composition, by chemical class, of flowers of wild-type (Col-0), cer1-1, and cer1-like1-1 lines. Amounts of components are expressed as µg.g−1 of fresh weight (FW). The data represent the means ± sd of three replicates (sec. n-alcohols, secondary fatty alcohols; prim. n-alcohols, primary fatty alcohols). Significant differences were assessed by Student’s t test (*P < 0.05; **P < 0.01; ***P < 0.001). F, Carbon-chain-length distribution within the major cuticular compound classes of flowers of wild-type (Col-0), cer1-1, and cer1-like1-1 lines. Amounts of components are expressed as µg.g−1 of fresh weight. Each wax constituent is designated by carbon chain length and is labeled by chemical class along the x axis (sec. n-alc, secondary fatty alcohols, ket, fatty ketones). The data represent the means ± sd of three replicates. Significant differences were assessed by Student’s t test (*P < 0.05; **P < 0.01; ***P < 0.001).

