Figure 6.
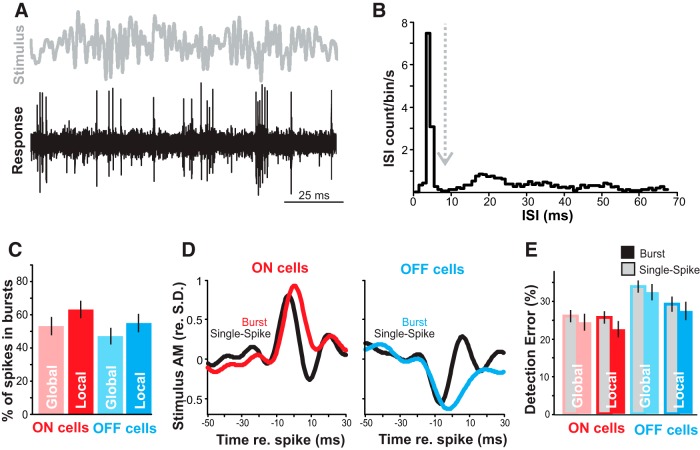
Coding of AM by bursts. A, Sample of noise stimulus (0–60 Hz, gray) and representative spike train (black) from an OFF cell during local stimulation. B, Example of ISI distribution used to determine burst threshold (dashed line). C, ON cells (red) burst more than OFF cells (blue; ANOVA, p = 0.02), and local stimulation produced more bursting than global stimulation (ANOVA, p = 0.01). Error bars show the SE. D, Mean burst-triggered averages (red/blue) and single spike-triggered averages (black) from ON and OFF cells show that bursts are triggered by wider (lower-frequency) stimulus features than single spikes. E, Feature detection performance for burst and isolated spikes. In both ON- and OFF-cell bursts (blue/red-filled bars) tend to have lower error rates (percentage of events signaling false positives or false negatives) in detecting optimal stimulus features than single spikes (gray-filled bars), but this trend is not significant (ANOVA, p = 0.10).

