. 2019 Mar 20;8:e39578. doi: 10.7554/eLife.39578

Figure 4. Persistent OptoGranules are cytotoxic and evolve to pathological inclusions in human iPSC-derived neurons.

(a) Schematic illustrating generation of iPSC-derived neurons stably expressing Opto-G3BP1. (b) iPSC-derived neurons expressing Opto-Control (mRuby) or Opto-G3BP1 (mRuby) were intermittently exposed to a 488 nm blue-light laser (90% laser power, power density 6.3 W/cm2) followed by image acquisition with a 561 nm channel. Representative images are shown from n = 3 independent experiments. (c) iPSC-derived neurons expressing Opto-Control or Opto-G3BP1 were exposed to chronic persistent stimulation as in Figure 3c and survival was assessed by counting living cells. n = 35 cells for Opto-Control and n = 34 cells for Opto-G3BP1. Data are representative of n = 3 independent experiments. ****p<0.0001 by log-rank (Mantel-Cox) test. (d) Timeline of pathological protein accumulation in OptoGranules in iPSC-derived neurons. (e-h) iPSC-derived neurons expressing Opto-G3BP1 were stimulated with continuous blue light (~2 mW/cm2) for indicated times using custom-made LED arrays and co-immunostained with MAP2 and TDP-43 antibodies (e), MAP2 and A11 antibodies (f), MAP2 and p-TDP-43 (P01) antibodies (g), or ubiquitin and SQSTM1 antibodies (h). See also Figure 4—figure supplement 1e for line scans of images shown in (h).(i) quantification of data from e-h. Error bars represent s.e.m. Images in e-h are representative of n = 3 independent experiments. *p=0.0489 (2 hr), ***p=0.0001 (5 hr) for SQSTM1 and ****p<0.0001 for pTDP-43 by one-way ANOVA with Dunnett’s test. Scale bars, 10 μm in all micrographs.

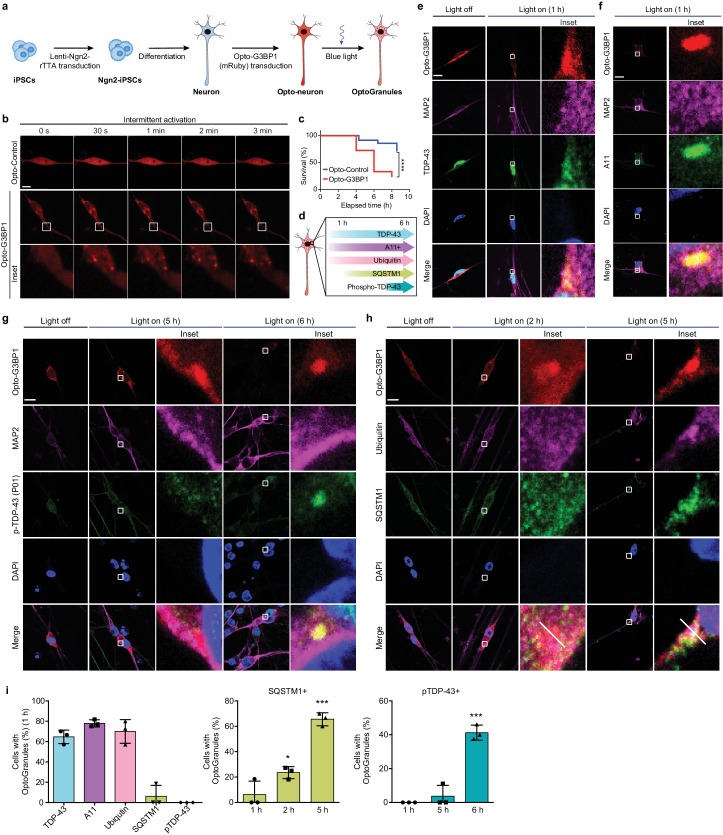
Figure 4.

Figure 4—figure supplement 1. iPSC-derived neurons form OptoGranules.

Figure 4—figure supplement 1.

(ab) Quantification of mRNA levels in iPSC-derived neurons before or after 1 and 2 weeks of Ngn2 lentiviral infection. Levels are normalized for RPP30 mRNA levels as an internal control. Panel b is shown on a logarithmic scale. (c) iPSC-derived neurons were treated with 0.25 mM sodium arsenite for 30 min or 42°C heat shock for 1 hr and then immunostained for MAP2 along with stress granule markers TIA1 and TDP-43. (d) U2OS cells stably expressing Opto-Control (mRuby) or Opto-G3BP1 (mRuby) were stimulated with continuous blue light (~2 mW/cm2) for 2 hr using custom-made LED arrays and then immunostained for PABP. (e) Top: Enlarged images from Figure 4h. Bottom: Line scans indicate the degree of colocalization between Opto-G3BP1 (red), ubiquitin (violet), and SQSTM1 (green) in lines drawn within the magnified images. Images are representative of n = 3 independent experiments. Scale bars, 10 μm in all micrographs.
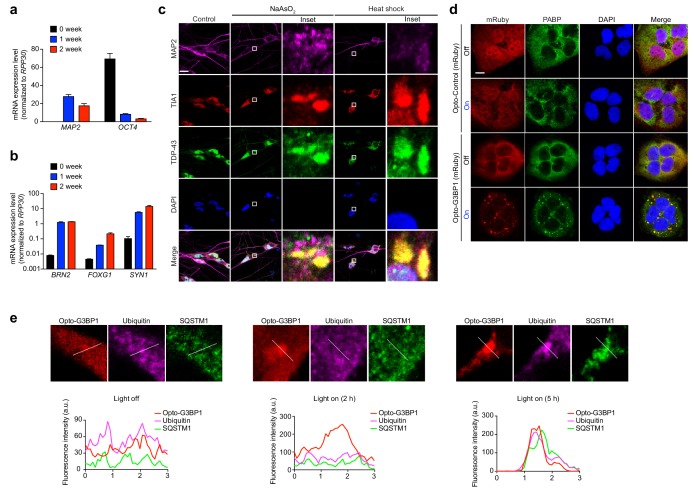
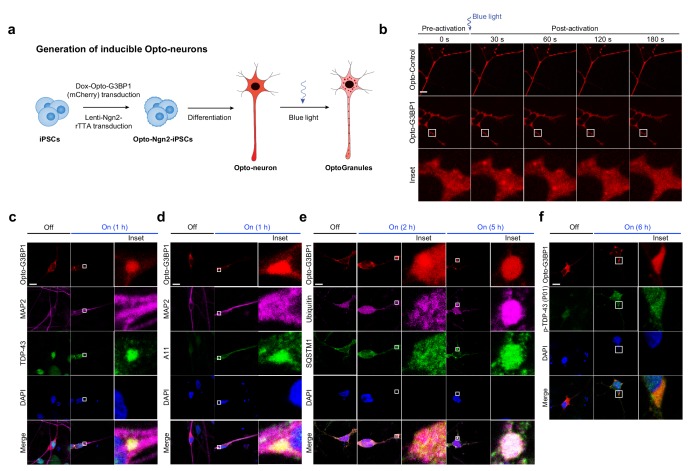
Figure 4—figure supplement 2. OptoGranules evolve to pathological inclusions in iPSC-derived neurons.

Figure 4—figure supplement 2.

(a) Schematic illustrating generation of iPSC-derived neurons in which doxycycline induces both differentiation and Opto-G3BP1(mCherry) expression. (b) iPSC-derived neurons expressing doxycycline-inducible Opto-Control (mCherry) or Opto-G3BP1 (mCherry) were stimulated with one 5-msec pulse of a blue light laser (power density ~2.5 MW/cm2). Representative images are shown from n = 3 independent experiments. (c-f) iPSC-derived neurons expressing doxycycline-inducible Opto-G3BP1 (mCherry) were stimulated with continuous blue light (~2 mW/cm2) for indicated times using custom-made LED arrays and co-immunostained with MAP2 and TDP-43 antibodies (c), MAP2 and A11 antibodies (d), ubiquitin and SQSTM1 antibodies (e), or p-TDP-43 (P01) antibodies (f). Images in c-f are representative of n = 3 independent experiments. Scale bars, 10 μm in all micrographs.