Figure 5. The signal of ancient balancing selection.
(A) Absolute number and (B) fraction of ssSNPs (blue), ts2-waySNPs (purple), and ts3-waySNPs (orange) for Capsella. Only sites accessible to read mapping in all three species were considered. (C) Derived allele frequency (using A. lyrata and A. thaliana as outgroup) of ssSNPs (blue), ts2-waySNPs (purple) and ts3-waySNPs (orange). (D) Pairwise diversity (π) as a function of distance from a ts3-waySNP in C. grandiflora, C. rubella, and C. orientalis. Bottom right, Divergence between the C. rubella/C.grandiflora and C. orientalis lineages as a function of distance from a ts3-waySNP. Black dots, means over all sites at a particular distance, and coloured lines, means over bins of 50 bp. (E) Enrichment of ts3-waySNPs and ts3-wayhqSNPs in candidate balanced regions from the C. rubella/C. grandiflora comparison. (F) Watterson’s estimator (Θw) of genetic diversity in C. orientalis, in 20 kb windows. Grey-to-blue scale indicates the genome-wide percentile of the same window for Θw) in C. rubella. (G) ts3hqSNP number in each window.
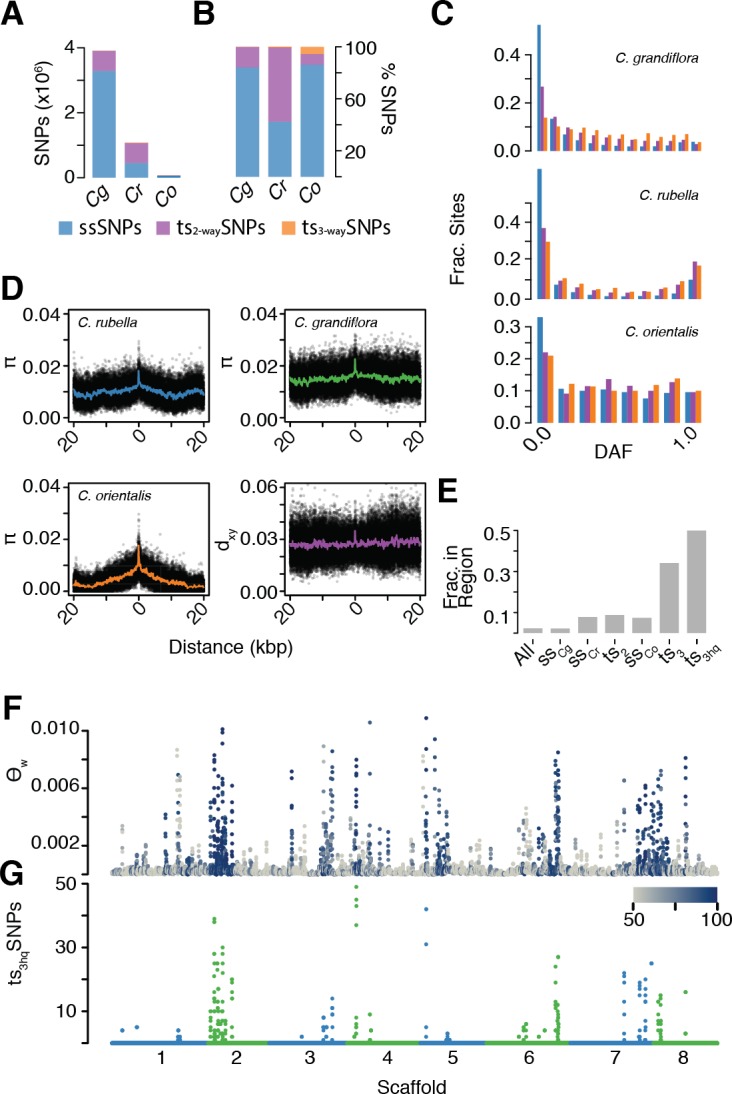
Figure 5—figure supplement 1. Distributions of concordance and coverage values for different SNP classes in C. orientalis.

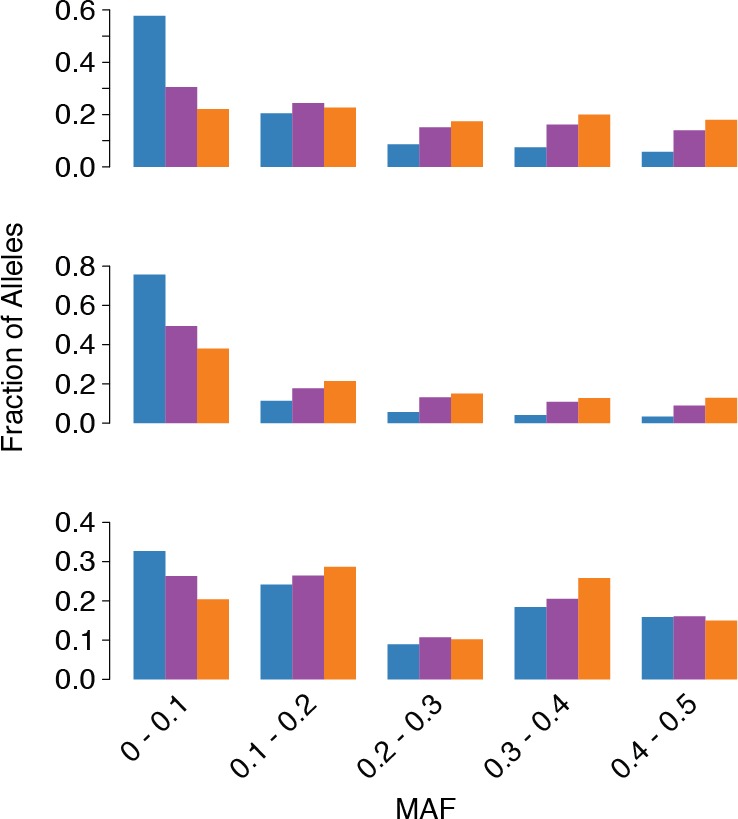
Figure 5—figure supplement 2. tr3-wayhqSNPs MAF.