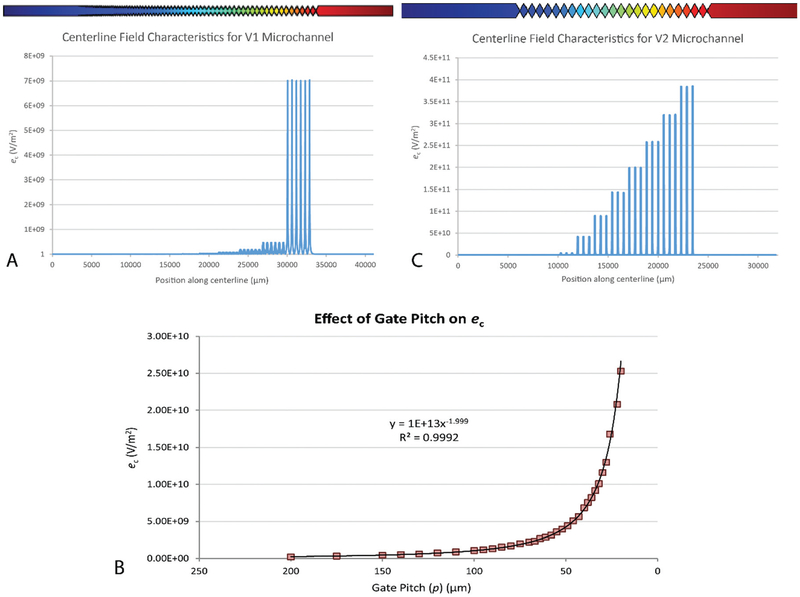
Fig. 2.
Comparison of microchannel designs between V1 and V2. The channel inlet and large p values are oriented to the left, while the outlet and small p values are oriented to the right. (A) Centerline values of ∇E2/E (or ec) modeled for the V1 microchannel. Specific values for ∇E2/E depend upon channel geometry and the applied potential (500 V for this model). Each set of gates consists of 6 geometrically equivalent gates, all with equal pitch. (B) Chart showing centerline maxima in ec for a hypothetical sawtooth microchannel. Values for ec are represented as a function of p (pitch, or distance between tooth tips at gates). The increase in ec with respect to p can be represented as a power function. (C) Centerline values of ∇E2/E modeled for a V2 microchannel. A progression of values for p was calculated to yield a linear step-wise increase in the local maxima of ∇E2/E between gate sets. Each set consists of three geometrically equivalent gates, all with equal p.

