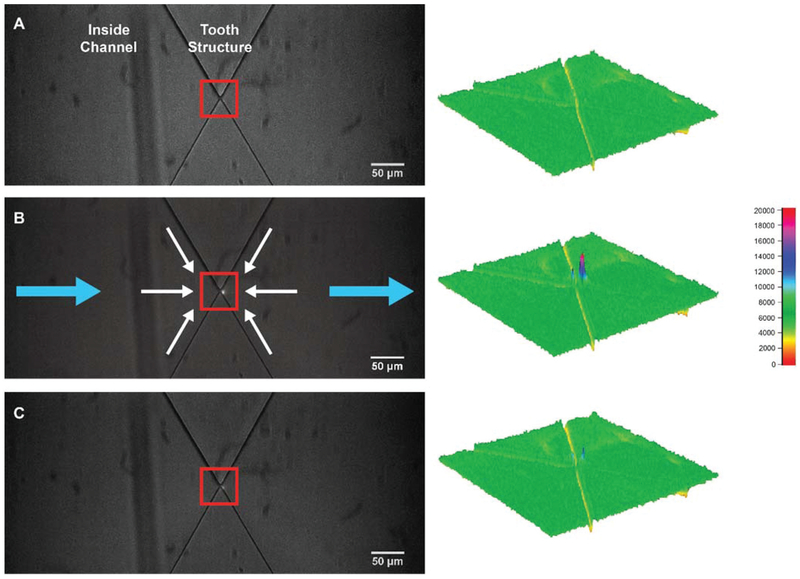
Fig. 4.
Images of virus accumulation and release at gate 20. (A) Evenly distribution of viral particles. No obvious fluorescence is detectable near the constriction prior to application of the voltage. (B) After 15 s with 300 V applied on the whole channel, there is clear accumulation of the fluorescent particles on the outlet side (right side) of the gate, represented as a constricted peak in the capturing zone in the corresponding fluorescent profile. Blue arrows indicate the direction of electrokinetic forces, while the white arrows are the directions of pDEP force. (C) Captured particles diffused away upon the removal of the voltage. Most fluorescence disappears at the region of capture. The surface plots on the right are the fluorescence intensity profiles of the area in the corresponding red boxes in the images.

