Fig. 5.
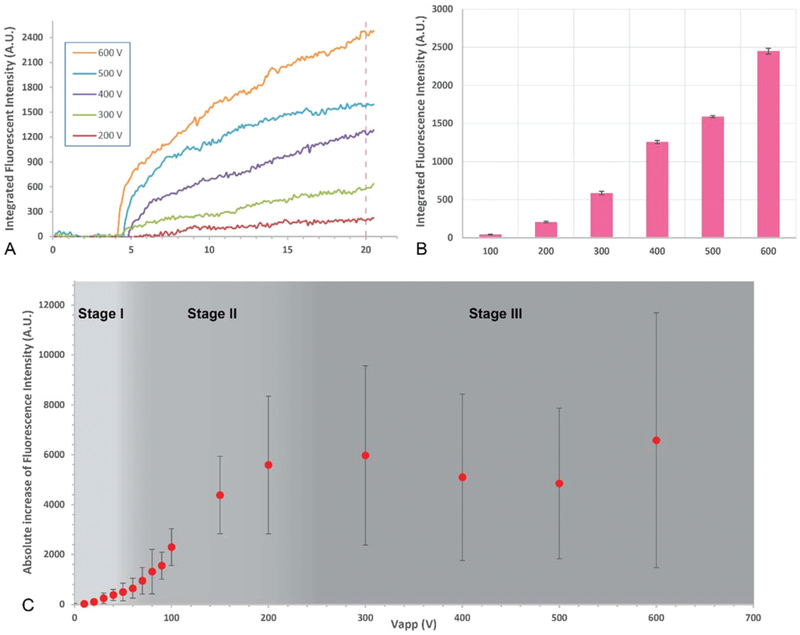
Data analysis of SVHR behavior at gate 20 (3.3 μm gap distance) with different Vapp. The concentration of SVHR is 1.5 × 10¹¹ pfu mL−1. (A) Real-time monitoring of integrated fluorescence intensity (FI) increase versus time with Vapp from 100 V to 600 V. (B) The integrated FI of the capturing zone with Vapp being on for the duration of 15 s, replot from the data at 20 s time point in A (indicated by the dashed line in A) at each Vapp. Error bars are based on the ten data points for ± 0.5 s. (C) By repeating the experiments with independent preparation of SVHR samples and each in a separated device, lower applied voltages between 0 V and 100 V were tested for more comprehensive understanding of the change of FI versus Vapp. The virus behavior shows in a stage-wise way with little or no capture at low voltages (stage I), rapid increase with increased Vapp (stage II) and leveling off during plateau (stage III). Error bars are the standard deviation (n = 3).

