
Table 3.
Potency comparison of small molecule inhibitors in VHH-based (dsELISA) and fluorescent assays, and equilibrium parameter (KD) obtained from bio-layer interferometry experiments.
| Cmpd. # | Structure | dsELISA, EC50,μM | Fluo. assay, IC50,μM | KDa (μM) |
|---|---|---|---|---|
| 1T | 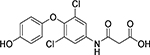 |
>200 | >50 | |
| KB2115 | 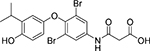 |
13±1 | 2.6 | |
| 2 T | 3.1±1.0 | 0.46 | ||
| 3 T | 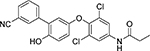 |
3.0±1.1 | 0.58 | |
| 4 T | 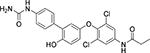 |
2.5±0.9 | 0.29 | 2.1 ± 0.7 |
| 5 T | 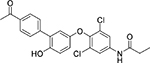 |
1.5±0.7 | 0.35 | |
| 6 T | 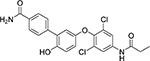 |
1.2±0.3 | 0.35 | 0.5 ± 0.1 |
| 7* | 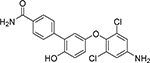 |
0.7±0.3 | 0.55 | 0.9 ± 0.1 |
| 8* | 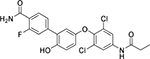 |
0.2±0.1 | 0.47 | 0.16 ± 0.02 |
Results are shown as mean ± SD (n = 2 or 3).
a
Data calculated based on steady state analysis
T
synthesized and reported in 15
*
synthesized and reported in this paper.