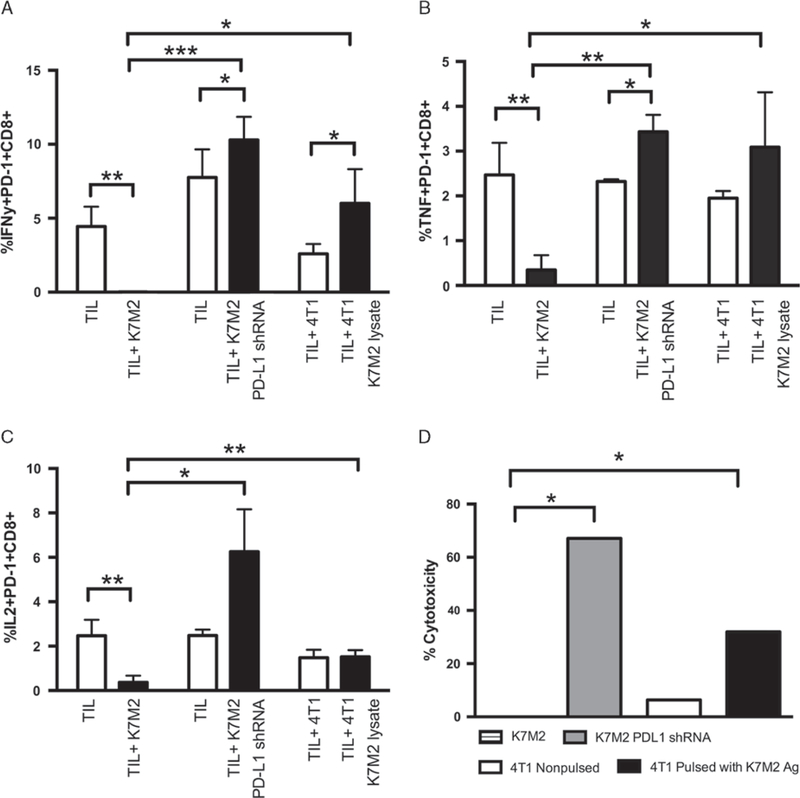
FIGURE 4.
Osteosarcoma-specific CTLs are deficient in cytokine production. 106 cells were stained for extracellular markers, and then fixed and permeabilized, and stained for IFN-γ, TNF, and IL-2 production. TIL CD8 were incubated with K7M2, 4T1 alone, 4T1 cells pulsed with K7M2 tumor lysate, or K7M2 transduced to be PD-L1 for 4 hours. Flow data were analyzed using FlowJo8.8, gating on the PD-1+ CD8 + population. White bars indicate cytokine production to no additional antigen (TILs incubated alone or with 4T1 not pulsed), whereas black bars indicate cytokine production to osteosarcoma cells (with or without PD-L1 expression) or osteosarcoma antigens. In each case, we are measuring the percentage of PD1 + CD8 + T cells that are expressing each of the 3 cytokines. A, Multiple t test comparing IFN-γ production by TIL CD8 alone versus cocultured with K7M2 cells gave a P-value = 0.0046. The t test comparing IFN-γ production by TIL CD8 cocultured with nonpulsed 4T1 versus pulsed 4T1 alone gave a P-value = 0.021. IFN-γ production by TIL CD8 cultured with K7M2 cells compared with 4T1 pulsed with K7M2 lysate gave a P-value = 0.0437. Finally, IFN-γ production by TIL CD8 cultured with K7M2 cells compared with K7M2 that are PD-L1 gave a P-value = 0.001. B, Multiple t test comparing TNF production by TIL CD8 alone versus cocultured with K7M2 cells gave a P-value = 0.009. The t test comparing TNF production by TIL CD8 cocultured with nonpulsed 4T1 versus pulsed 4T1 gave a P-value = 0.05. TNF production by TIL CD8 cultured with K7M2 cells compared with 4T1 pulsed with K7M2 lysate gave a P-value = 0.02. Finally, TNF production by TIL CD8 cultured with K7M2 cells compared with K7M2 with negative PD-L1 expression gave a P-value = 0.002. C, Multiple t test comparing IL-2 production by TIL CD8 alone versus cocultured with K7M2 cells gave a P-value = 0.009. IL-2 production by TIL CD8 cultured with K7M2 cells compared with 4T1 pulsed with K7M2 lysate gave a P-value = 0.025. Finally, IL-2 production by TIL CD8 cultured with K7M2 cells compared with K7M2 with negative PD-L1 gave a P-value = 0.0107. Open bars signify TILs cultured alone, black bars signify TILs + antigen. D, LDH ELISA confirming lack of cytotoxicity through tumor-reactive T cells when cocultured with K7M2 tumor cells. This is compared with a control of 4T1 antigen-presenting cells (APCs) that are PD-L1 , either nonpulsed or pulsed with K7M2 tumor lysate, or K7M2 cells transduced to be PD-L1 . The t test comparing effector responses to K7M2 versus APCs pulsed with K7M2 tumor lysate was significantly different (P < 0.0001). The t test comparing effector responses to K7M2 versus K7M2 for PD-L1 was significantly different (P < 0.0001). *P < 0.05, **P < 0.01, ***P < 0.001 ****P < 0.0001.

