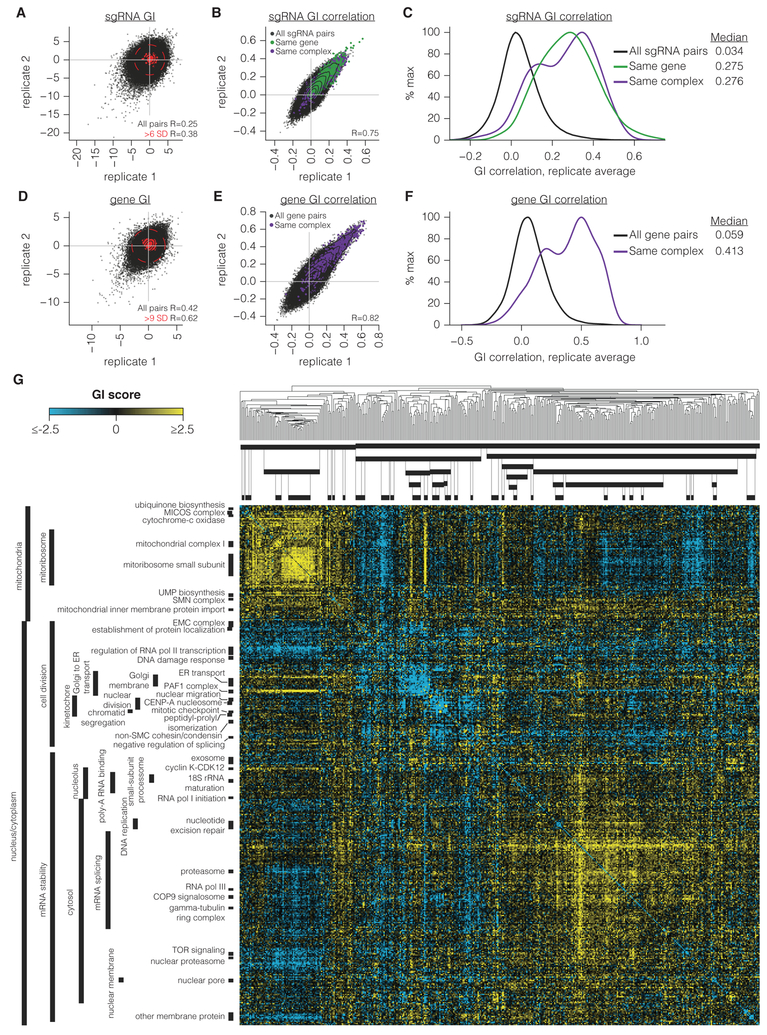
Figure 2. A large-scale CRISPRi-based GI map.
(A-B) sgRNA GI scores (A) and GI correlations (B) from two independent replicates performed in K562. Contours correspond to 99th, 95th, 90th, 75th, 50th, and 25th percentiles of data density. Pearson correlation (R) is of all sgRNA pair correlations. Due to the size of the dataset, Pearson P-values here and throughout the manuscript are < 10−300 unless otherwise stated. (C) Histogram of sgRNA GI correlations calculated from replicate-averaged sgRNA pair phenotypes. Smoothed histograms of all pairs of sgRNAs or only sgRNA pairs targeting the same gene or complex were generated with Gaussian kernel density estimation. (D-E) Gene-level GI scores (D) and GI correlations (E), displayed as in A-B. (F) Histogram of gene GI correlations from replicate-averaged screens, displayed as in C. (G) Full gene-level GI map in K562. Dendrogram indicates average linkage hierarchical clustering based on uncentered Pearson correlations between genes. Clusters were annotated by assigning GO annotations if the GO term was significantly enriched in that cluster (hypergeometric P ≤ 10−9) and not more enriched in another cluster.

