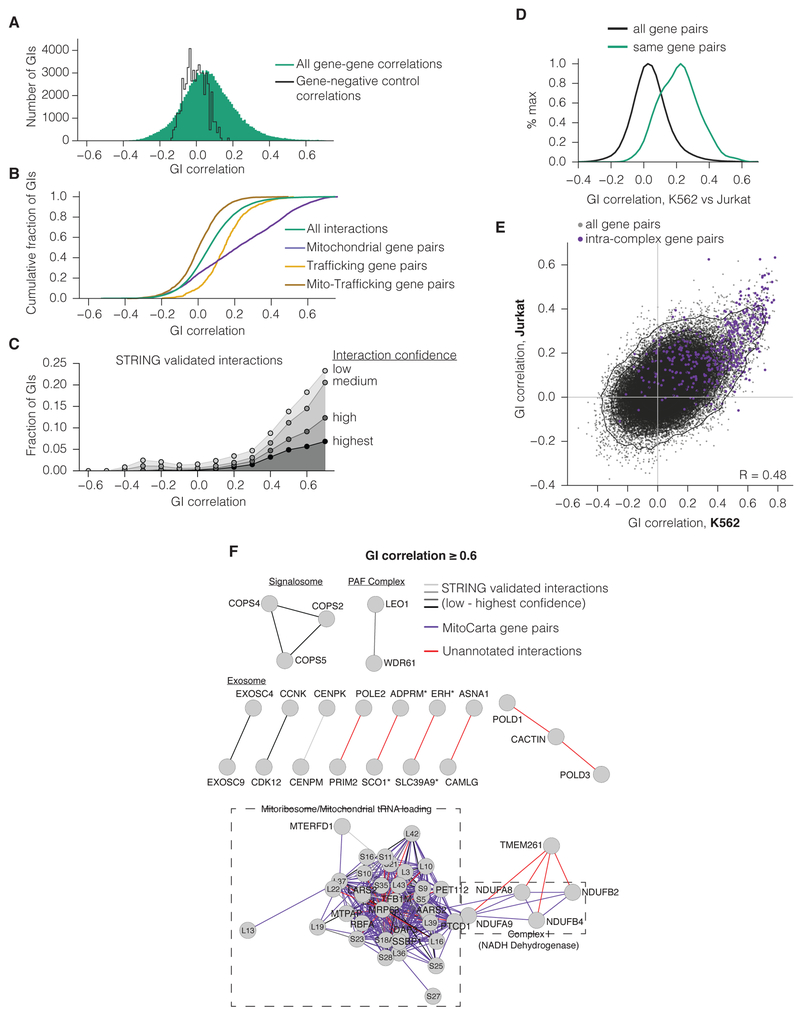
Figure 3. GI correlations identify members of protein complexes and functionally related pathways.
(A) Histogram of all correlations between K562 gene GI profiles (green) or between non-targeting (NT) control and gene GI profiles (black). (B) Cumulative distribution of GI correlations for all genes (as in A), for gene pairs within mitochondria or early trafficking, or for pairs with one gene in each compartment. (C) Fraction of gene pairs with a given GI correlation annotated by the STRING experimentally validated interaction set. GI correlations were binned to the next-lowest tenth. (D) Histogram of the correlations between GI score profiles in K562 and Jurkat maps. Only genes present in both K562 and Jurkat are included. (E) Comparison of GI correlations within each GI map. (F) Gene networks of the most highly correlated genes in K562. Edges represent correlations greater than 0.6. GI correlations that correspond both to STRING-annotated interactions and to MitoCarta gene pairs were labeled according to their STRING interaction confidence. Edge lengths were determined by force-directed layout. Asterisks indicate gene pairs that have closely neighboring TSSs.

