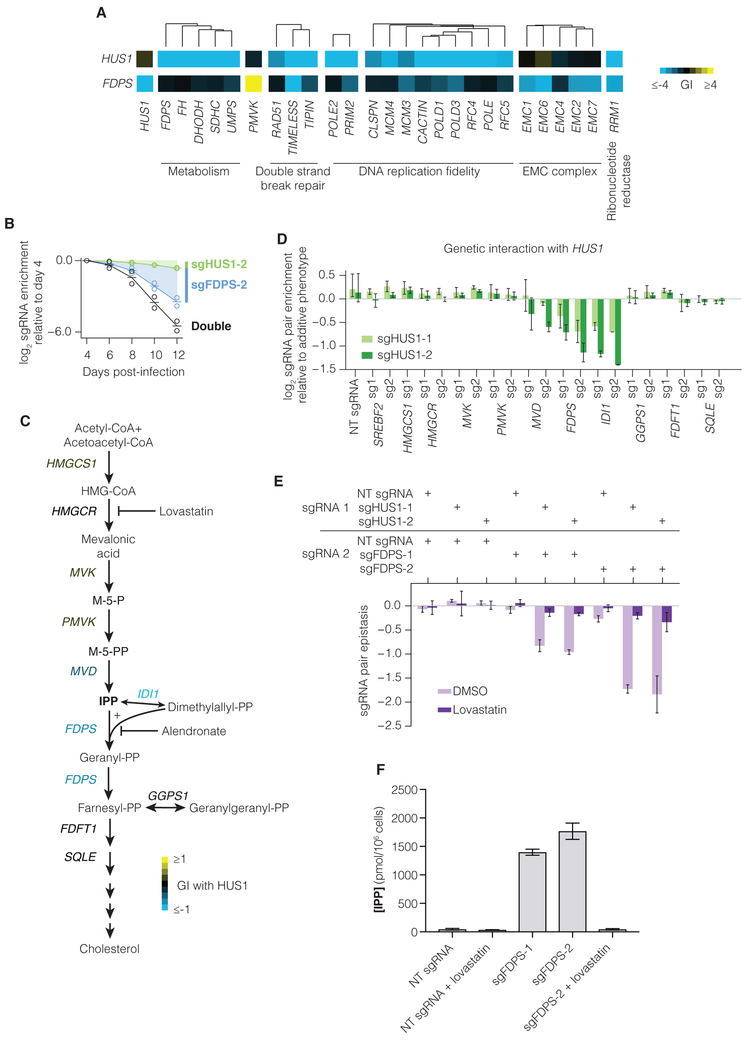
Figure 6. Repression of FDPS is synthetic lethal with HUS1 and results in accumulation of the cholesterol intermediate IPP.
(A) Selected interactions with HUS1 and with FDPS in the K562 GI map. (B) Individual validation experiments sgRNAs targeting HUS1 and FDPS, performed as in Figure S4A. Lines represent mean of two experimental replicates (open circles). (C) Schematic of the cholesterol biosynthesis pathway. Gene names are colored by mean validation GI (see also Figure 6D) of all sgRNA pairs targeting HUS1 and the indicated gene. (D) sgRNA pair epistasis for sgRNAs targeting HUS1 and cholesterol biosynthesis genes. Epistasis was calculated as the measured double-sgRNA phenotype subtracted by the sum of the individual phenotypes and by epistasis with non-targeting (NT) sgRNA. Bars represent mean of duplicate experiments and error bars represent the maximum and minimum data points. (E) Epistasis between sgRNAs targeting HUS1 and FDPS in the presence of DMSO control or 4 μM lovastatin. (F) IPP concentration in cells containing NT or FDPS-targeting sgRNAs grown in the presence or absence of 4 μM lovastatin for 48 hours. N=6 replicates each (4 for lovastatin-treated samples).

