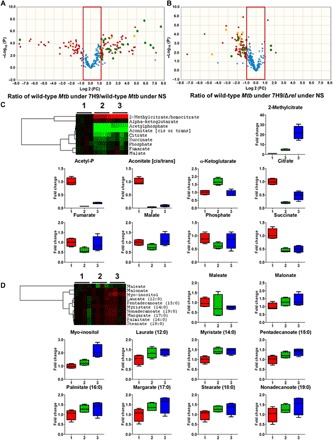
Fig. 2. The nutrient-starved Δrel mutant has a metabolomics profile similar to that of WT Mtb in nutrient-rich broth (7H9).

Volcano plots of relative abundances of metabolites of the WT strain following exposure to 7H9 versus WT strain following exposure to NS (A) and between WT strain following exposure to 7H9 versus Δrel following exposure to NS (B). FC, fold change. The y axis indicates −log10 [P], and the x axis indicates relative abundance in log 2 scale. The effect of RelMtb deficiency on Mtb metabolic responses while adapting to NS was monitored by analyzing pathways involved in energy metabolism (C) and fatty acid metabolism (D). In clustered heat maps, rows depict experimental conditions as indicated, starting from WT strain control (WT day 0) followed by WT day 1 and Δrel day 1. Columns indicate individual metabolites. Data were parsed using uncentered Pearson’s correlation with centroid linkage clustering and were rendered using the image generation program TreeView (http://jtreeview.sourceforge.net/). Data are depicted on a log 2 scale relative to untreated control for each experimental condition. (1, WT Mtb in 7H9; 2, WT Mtb during NS; 3, Δrel during NS).
