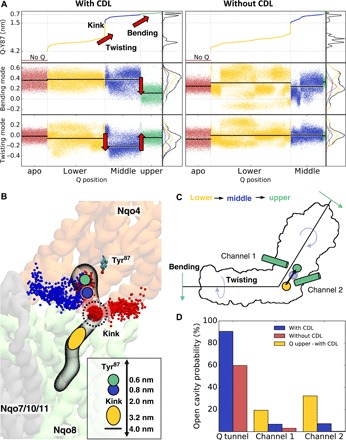
Fig. 4. CDL modulates quinone and complex I dynamics.

(A) Projection of complex I dynamics with and without CDL along the bending (PC1) and twisting (PC2) modes sorted by the quinone (Q) position along the tunnel. The quinone position is determined by the distance between the quinone headgroup and Tyr87. The quinone motion along the cavity is coupled to the complex I motion along the bending and twisting modes. (B) Quinone binding sites and channels connecting the quinone cavity with the N-side of the membrane. The upper binding sites (d ~ 0.6 to 0.8 nm from Tyr87) are shown as green and blue circles, the kink region is marked at d ~ 2.0 nm, and the lower binding sites (d ~ 3.2 to 4.0 nm) are shown as a yellow oval. Channel 1 (blue) is located near the Nqo7 loop region, and channel 2 (in red) is located at the interface between Nqo8 and Nqo9. Both channels are more stable in simulations with CDL and when quinone is bound at the upper site (d ~ 0.6 to 0.8 nm) (see also movie S2). Inset: Distance between Tyr87 and the kink region and different quinone binding sites. (C) Schematic representation of structural changes in complex I that couple to the quinone motion. (D) Probability of finding open cavities connected to the quinone binding site.
