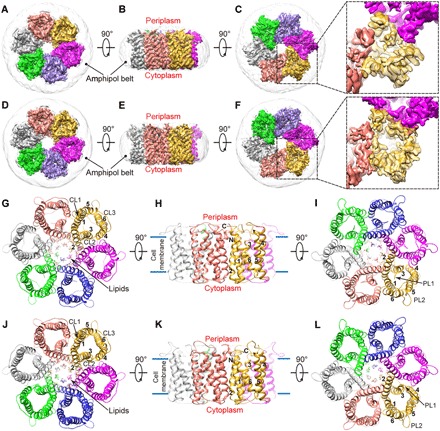
Fig. 1. Cryo-EM density maps and atomic models of 6hisHpUreI.

(A to F) Shaded surface views of the cryo-EM density maps of 6hisHpUreI in the closed (A to C) and open (D to F) conformations viewed from the cytoplasm (A and D), plane of the membrane (B and E), and periplasm (C and F). Protomers are colored separately, and amphipol is in gray. (G to L) Ribbon diagrams of the atomic models of 6hisHpUreI in the closed (G to I) and open (J to L) conformations viewed as in (A) to (F). Transmembrane helices (TM1 to TM6) are numbered 1 to 6; N and C termini are indicated by N and C; cytoplasmic loops (CL) and periplasmic loops (PL) are labeled CL1 to CL3 and PL1 and PL2, respectively. Lipids are shown as sticks.
