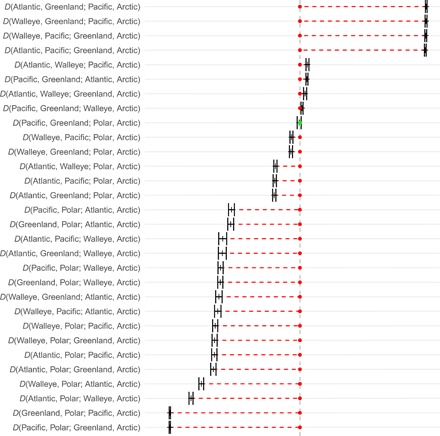
Fig. 3. D statistics with two SEs for the whole genome and fit to the classical phylogeny of these taxa.

On the basis of transversions with transitions removed. The green dot is for D not significantly different from zero, and red dotted lines mark the size of deviation of significant values. The dashed vertical line represents no introgression, a D = 0. For each test, the four taxa are arranged in a tree (((H1, H2)H3)H4), where H4 is the Arctic cod as the outgroup and every other taxon is rotated into the position of potential introgressor (H3, second from the right), as well as into the positions of potential recipients of introgression (H1 and H2, the two leftmost taxa of each line). A positive D implies that H2 is closer to the potential introgressor (H3) than H1 is. The opposite is true for a negative D. The figure was made with admixturegraph (58).
