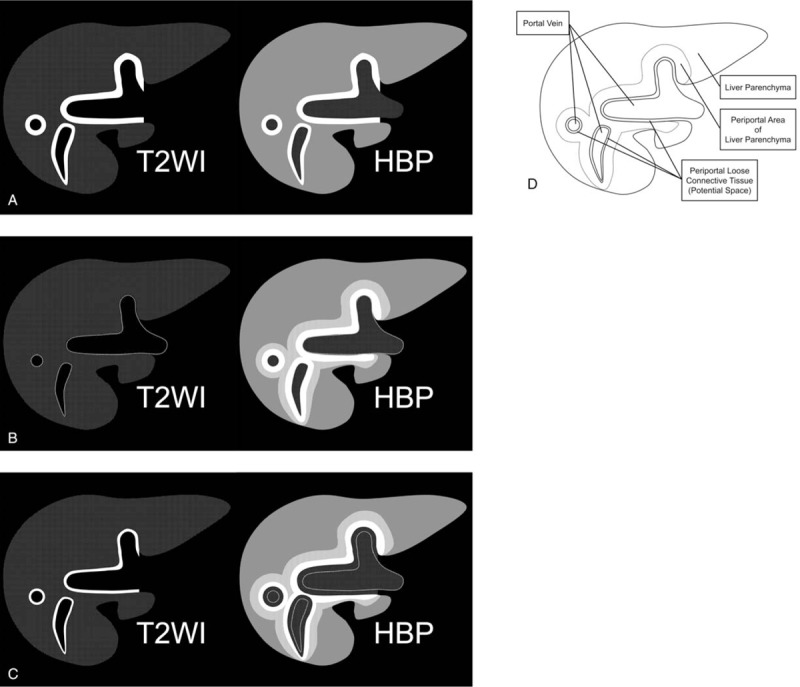
Figure 1.

Schematic illustrations of periportal enhancement patterns on hepatobiliary phase gadoxetate disodium-enhanced MR images. (a) Corresponding periportal enhancement pattern. The periportal enhancement areas during the hepatobiliary phase match the periportal hyperintense areas on fat-suppressed T2-weighted images (type A). (b and c) Noncorresponding periportal enhancement pattern. Periportal hyperintensity on T2-weighted images was absent (type B) or periportal enhancement areas are located immediately outside of the periportal T2-hyperintense areas (type C). (d) Anatomy of periportal areas in the liver. HBP = hepatobiliary phase image, MR = magnetic resonance, T2WI = T2-weighted image.
