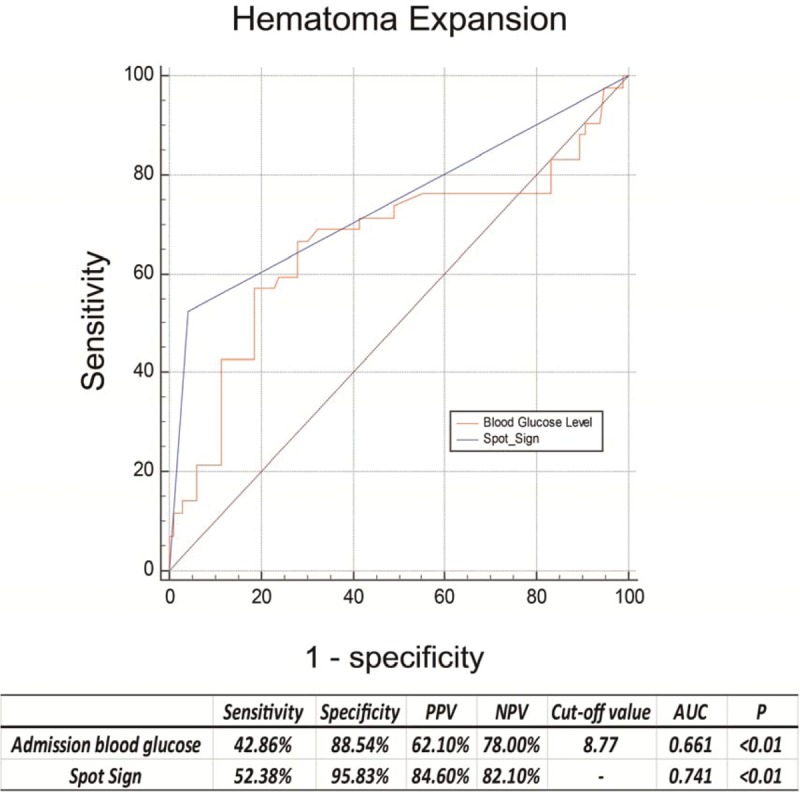
Figure 2.

Receiver operating characteristic curves of blood glucose and spot sign with their corresponding areas under the curve (AUC) for predicting early hematoma growth. The best cut-off points were identified with their sensitivity, specificity, positive predictive value (PPV) and negative predictive value (NPV), respectively.
