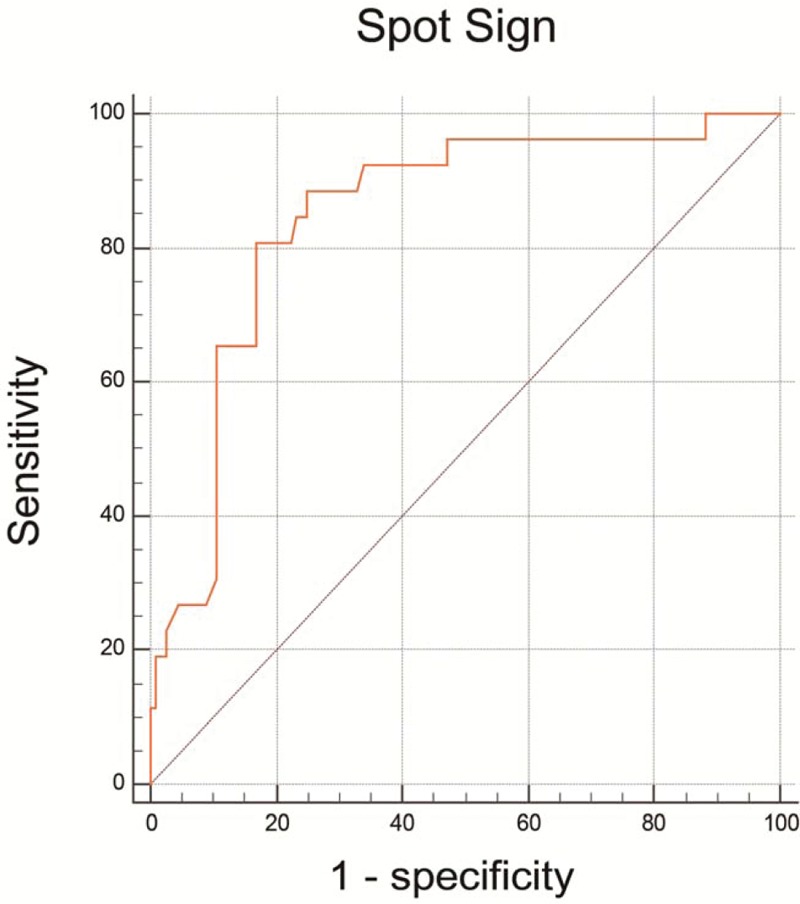
Figure 3.

Receiver operating characteristic curves of admission blood glucose for predicting spot sign. The areas under the curve (AUC), sensitivity, specificity, positive predictive value (PPV) and negative predictive value (NPV) of serum glucose for predicting island sign were 0.828,80.77%, 83.04%, 52.50%, 94.90%, respectively. AUC = area under the curve, NPV = negative predictive value, PPV = positive predictive value.
