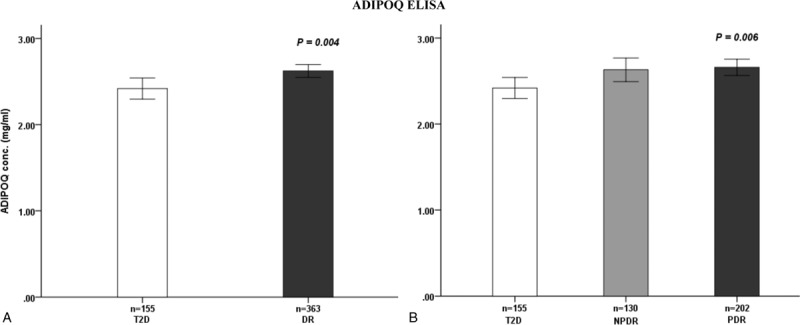
Figure 2.

Plasma adiponectin level in diabetic patients. A, Comparison of the levels in diabetic subjects without (T2D) and with retinopathy (DR). B, Comparison of the levels in diabetic subjects without retinopathy (T2D), with NPDR), and with PDR. DR = diabetic retinopathy, NPDR = nonproliferal retinopathy, PDR = proliferal retinopathy, T2D = type 2 diabetes.
