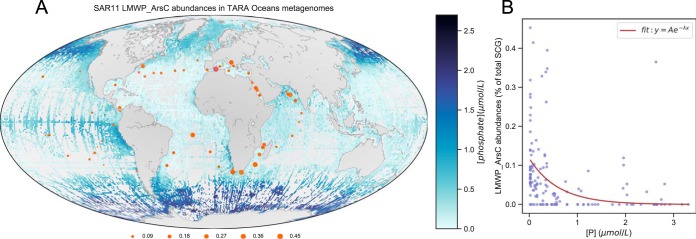
FIG 1.
Oceanic phosphate concentrations and SAR11 LMWPc_ArsC gene relative abundances in TARA Oceans metagenomic data (expressed as percentages of the total number of SAR11 single-copy genes found per sample). (A) Global phosphate measurements from NOAA World Ocean Atlas 2013 version 2 (https://www.nodc.noaa.gov/OC5/woa13/woa13data.html) showing regions of low and high phosphate concentrations. Gray patches in the oceans indicate missing data abundances and surface phosphate concentrations measured during the TARA Oceans Expedition. (B) An inverse exponential model (inset) applied to the data yielded a y of 0.1176 × e−1.653[P], with an r2 of 0.126. The P values were 3.33 × 10⁻¹⁶ for the scalar A estimate of 0.1176 and 0.006455 for the rate value estimate of −1.653. TARA Oceans phosphate measurements were obtained from Table W8 of the companion website (http://ocean-microbiome.embl.de/data/OM.CompanionTables.xlsx). A custom python script, osu_plot_TARA_arsenate_reductases_map.py (https://bitbucket.org/jimmysaw/arsenic/src/master/osu_plot_TARA_arsenate_reductases_map.py), was used to plot the distribution of SAR11 LMWPc_ArsC bacteria as a fraction of SAR11 single-copy conserved genes identified in TARA Oceans samples plotted over a world map showing global ocean surface phosphate concentrations. The same Python script also calculated the correlation of standardized LMWPc_ArsC abundances versus phosphate concentrations measured during the TARA Oceans Expedition in 2011. SCG, single-copy genes.

