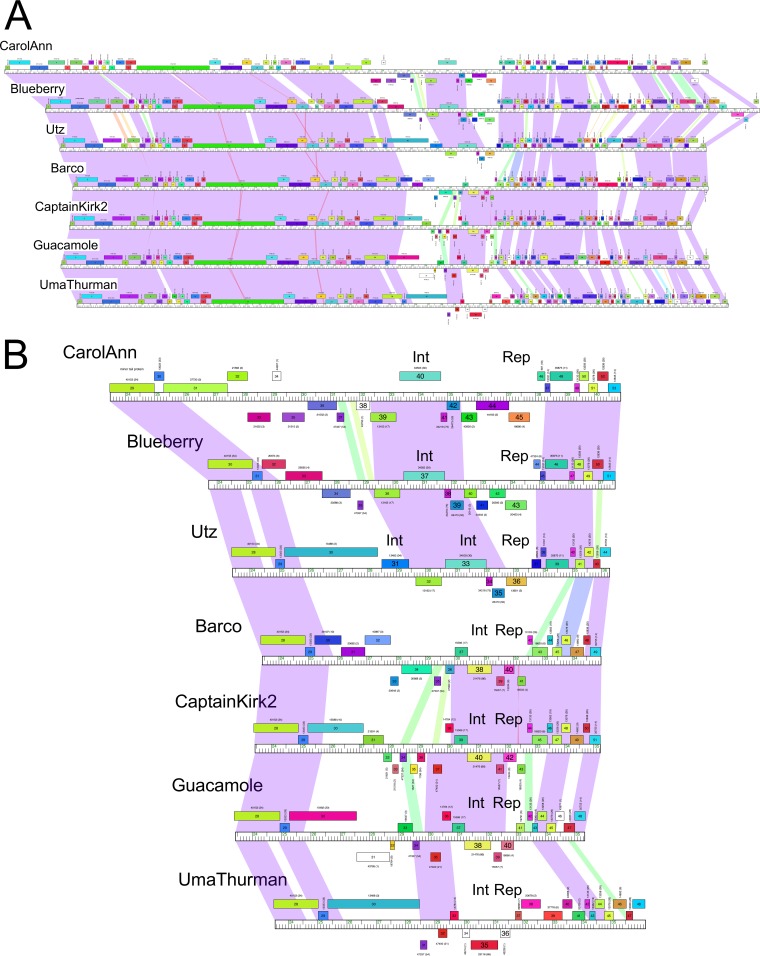
FIG 1.
Comparisons of cluster CV Gordonia phages. (A) The genome maps of cluster CV phages CarolAnn, Blueberry, Utz, Barco, CaptainKirk2, Guacamole, and UmaThurman (top to bottom) are shown with spectrum-colored shading between each genome reflecting nucleotide sequence similarity (with violet representing greatest similarity and red the least similarity above a threshold E value of 10−4; white areas are below the threshold value). Phages shown correspond to the lysogens shown in Table 1. (B) An expanded view of the central parts of these genomes displayed as described in the panel A legend. The locations of the integrase (Int) and immunity repressor (Rep) genes are indicated. Genes are shown as colored boxes above and below genome rulers. Gene numbers are shown within the boxes, and the assigned Pham numbers (45) are shown above the boxes, with the number of Pham members shown in parentheses. Gene boxes are colored according to their Pham assignment.

