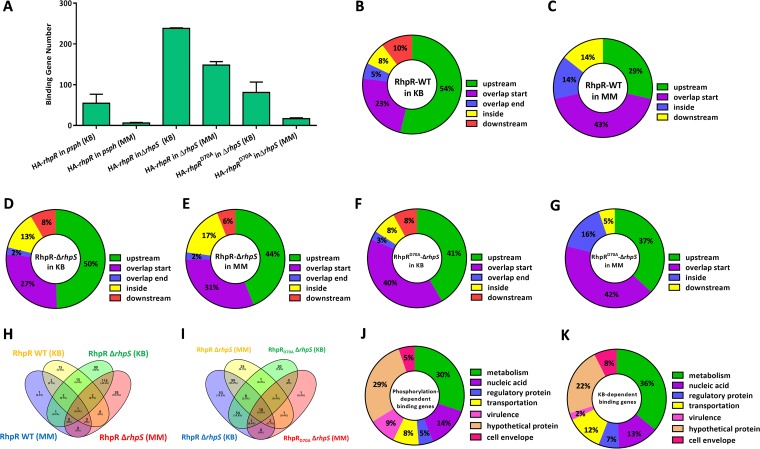
FIG 2.
Genome-wide analysis of the KB- or phosphorylation-dependent RhpR-binding regions by ChIP-seq. ChIP-seq reveals in vivo binding sites of RhpR. (A) The numbers of RhpR or RhpRD70A binding peaks under different culture conditions are shown. The ChIP-seq analyses were repeated twice. (B to G) The positions of the RhpR or RhpRD70A binding peaks are represented in a pie chart. (H) A Venn diagram shows the comparisons of the RhpR-binding genes in the wild-type or ΔrhpS strain cultured in a different medium. Purple represents RhpR binding sites in the wild-type strain cultured in MM, yellow represents RhpR binding sites in the wild-type strain cultured in KB, green represents RhpR binding sites in the ΔrhpS strain cultured in KB, and pink represents RhpR binding sites in the ΔrhpS strain cultured in MM. (I) A Venn diagram shows the comparisons of the RhpR or RhpRD70A binding genes in the wild-type or ΔrhpS strain cultured in different media. Purple represents RhpR binding sites in the wild-type strain cultured in MM, yellow represents RhpR binding sites in the wild-type strain cultured in KB, green represents RhpRD70A binding sites in the ΔrhpS strain cultured in KB, and red represents RhpRD70A binding sites in the ΔrhpS strain cultured in MM. (J and K) The pie charts display the percentage of KB- or phosphorylation-dependent RhpR targets with functional categories based on the Pseudomonas database (http://pseudomonas.com).

