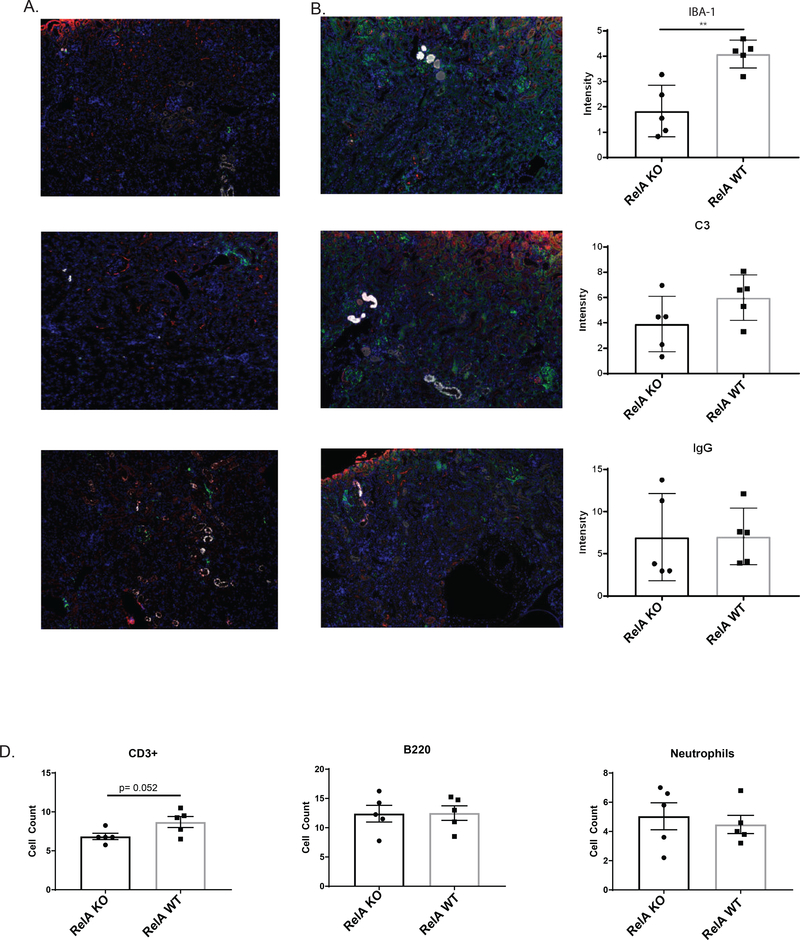
Figure 4. Renal cell infiltration.
Kidney sections were stained for macrophages (IBA-1, green), C3 (red), and IgG (white) in myeloid RelA KO mice (A) and WT mice (B). There was a significant reduction in macrophage infiltration in KO mice, but no difference in IgG and C3 deposition (C). CD3+ T cells trended towards being lower in KO mice (D); however; there was no difference in B cells (B220+) and neutrophils (Ly6G+). Shown are the results from one cohort (RelA KO, n = 5, RelA WT, n = 5). Significance was assessed using a student’s T-Test.

