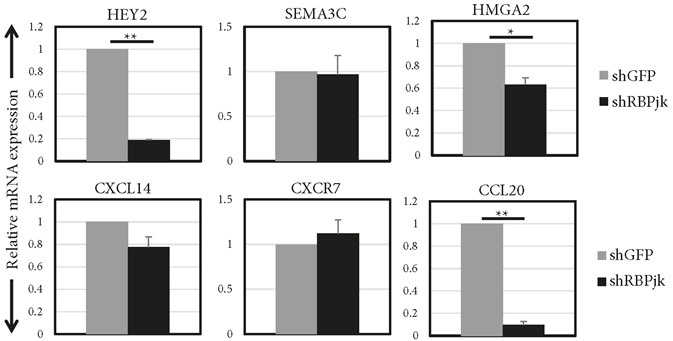
Figure 3.

mRNA expression levels of candidate genes in response to Notch inhibition. Relative mRNA expression levels of candidate genes and Notch target HEY2 were analysed 48 h after infection of MDA MB 231 cells with control virus (shGFP) or virus expressing shRNA against RBPjk (shRBPjk). Averages of three independent experiments are shown. Error bars represent standard deviation. (P values: *: <0.0005, **: <0.000005).
