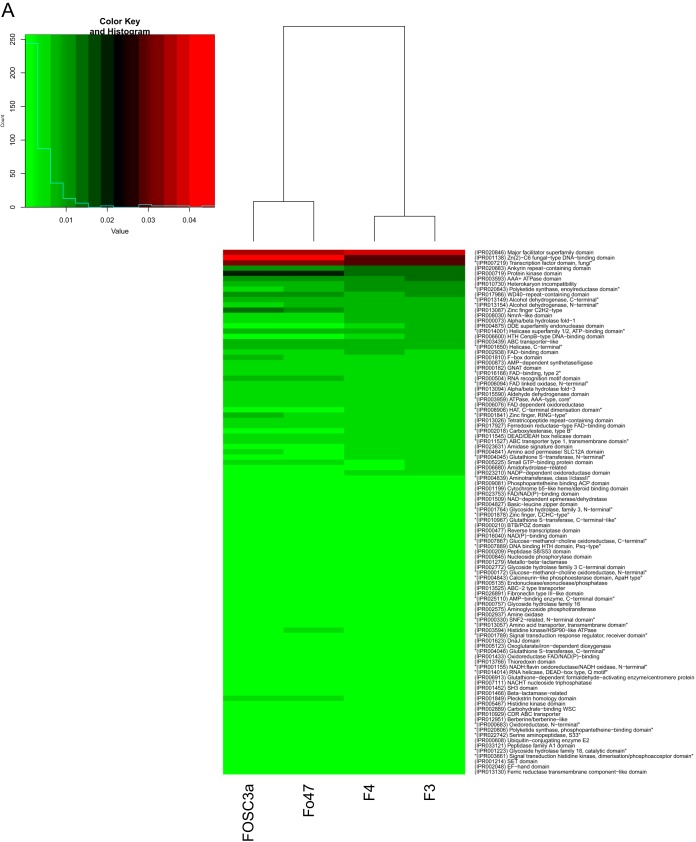
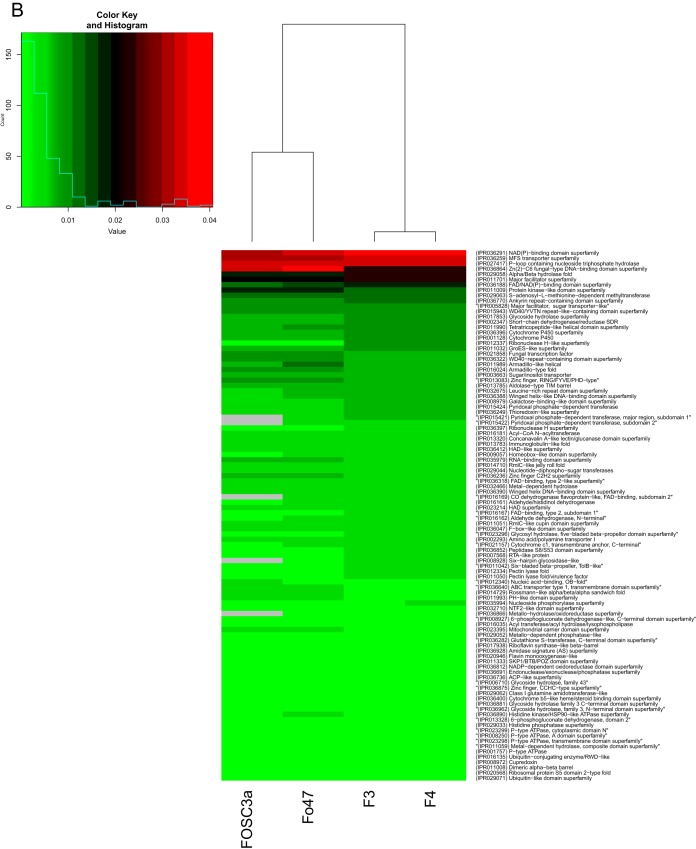
FIG 4.
Annotation of protein domains and protein families with InterProScan. Protein families were classified and domains were predicted using InterProScan. The heat map shows the relative abundances of the top 100 most abundant domains (A) and families (B) in ISS-F3/F4, in addition to a non-plant-pathogenic soil isolate (Fo47) and a clinical isolate, isolated from a patient with fusariosis (FOSC-3a). Red represents high relative abundances, and green represents low relative abundances.


