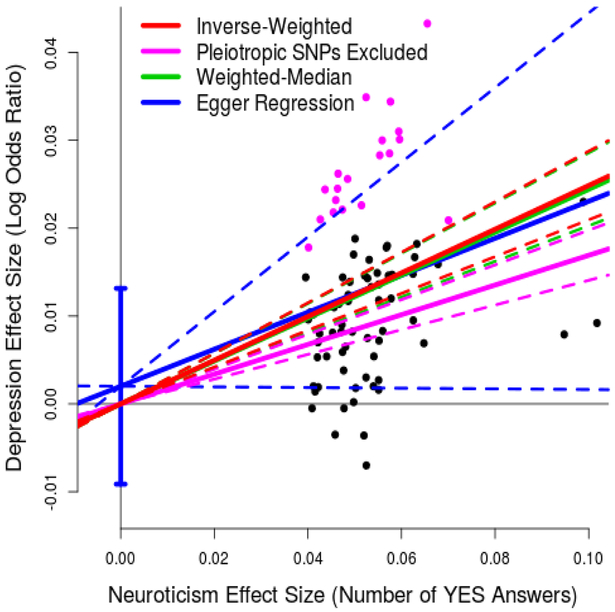
Figure 1. Results of Mendelian Randomization (neuroticism to depression).

For 82 independent, genome-wide significant (P<5e-8) SNPs for neuroticism, points report per-allele effect sizes for neuroticism and depression (the units are number of YES answers to the 12 neuroticism items on the Eysenck Personality Questionnaire and log odds ratio, respectively). The solid red line indicates the estimated slope from inverse-variance regression (the solid purple line indicates the slope if the purple SNPs, those nominally associated with depression, are excluded). The solid green line indicates the estimated slope from weighted-median regression; the solid blue line indicates the estimated slope from Egger Regression (the vertical blue segment marks a 95% confidence interval for the intercept). The four pairs of dashed lines mark 95% confidence intervals for the slopes.
